29
/
en
AIzaSyAYiBZKx7MnpbEhh9jyipgxe19OcubqV5w
April 1, 2024
66044
Algeria
DZA
true
2
1
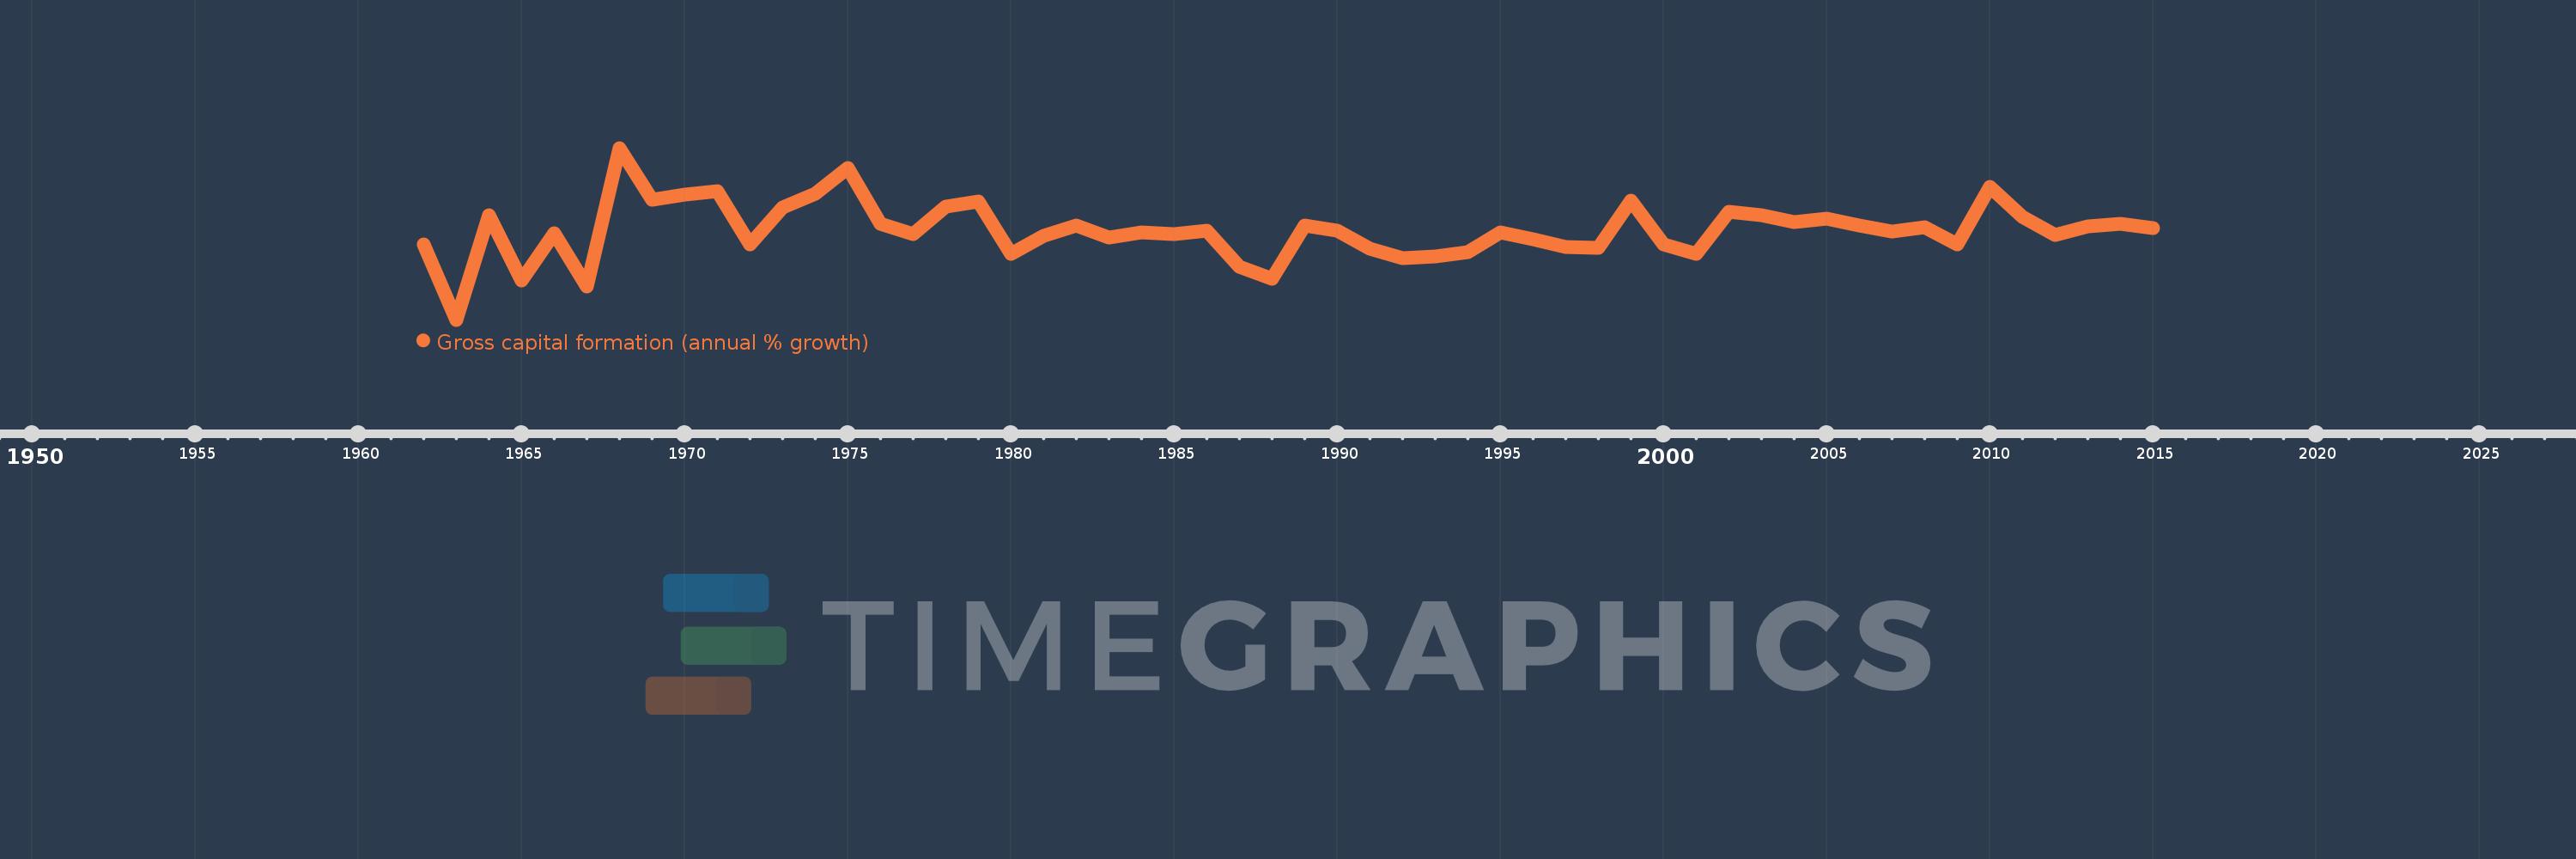
Gross capital formation (annual % growth)
2015,2014,2013,2012,2011,2010,2009,2008,2007,2006,2005,2004,2003,2002,2001,2000,1999,1998,1997,1996,1995,1994,1993,1992,1991,1990,1989,1988,1987,1986,1985,1984,1983,1982,1981,1980,1979,1978,1977,1976,1975,1974,1973,1972,1971,1970,1969,1968,1967,1966,1965,1964,1963,1962
This statistics in other country:
AlbaniaAlgeriaAntigua and BarbudaArab WorldArgentinaArmeniaAustraliaAustriaAzerbaijanBahamas, TheBahrainBangladeshBarbadosBelarusBelgiumBelizeBeninBhutanBoliviaBosnia and HerzegovinaBotswanaBrazilBrunei DarussalamBulgariaBurkina FasoBurundiCabo VerdeCambodiaCameroonCanadaCaribbean small statesCentral Europe and the BalticsChadChileChinaColombiaComorosCongo, Dem. Rep.Congo, Rep.Costa RicaCote d'IvoireCroatiaCubaCyprusCzech RepublicDenmarkDjiboutiDominican RepublicEarly-demographic dividendEast Asia & PacificEast Asia & Pacific (excluding high income)East Asia & Pacific (IDA & IBRD countries)EcuadorEgypt, Arab Rep.El SalvadorEquatorial GuineaEritreaEstoniaEthiopiaEuro areaEurope & Central AsiaEurope & Central Asia (excluding high income)Europe & Central Asia (IDA & IBRD countries)European UnionFijiFinlandFranceGabonGambia, TheGeorgiaGermanyGhanaGreeceGuatemalaGuineaGuinea-BissauHaitiHeavily indebted poor countries (HIPC)High incomeHondurasHong Kong SAR, ChinaHungaryIBRD onlyIcelandIDA & IBRD totalIDA blendIDA onlyIDA totalIndiaIndonesiaIran, Islamic Rep.IrelandIsraelItalyJamaicaJapanJordanKazakhstanKenyaKorea, Rep.KosovoKuwaitKyrgyz RepublicLao PDRLate-demographic dividendLatin America & Caribbean Latin America & Caribbean (excluding high income)Latin America & the Caribbean (IDA & IBRD countries)LatviaLeast developed countries: UN classificationLebanonLiberiaLithuaniaLow & middle incomeLow incomeLower middle incomeLuxembourgMacao SAR, ChinaMacedonia, FYRMadagascarMalawiMalaysiaMaliMaltaMauritaniaMauritiusMexicoMiddle East & North AfricaMiddle East & North Africa (excluding high income)Middle East & North Africa (IDA & IBRD countries)Middle incomeMoldovaMongoliaMontenegroMoroccoMozambiqueNamibiaNepalNetherlandsNew ZealandNicaraguaNigerNigeriaNorth AmericaNorwayOECD membersOmanOther small statesPakistanPanamaPapua New GuineaParaguayPeruPhilippinesPolandPortugalPost-demographic dividendPre-demographic dividendPuerto RicoQatarRomaniaRussian FederationRwandaSaudi ArabiaSenegalSerbiaSeychellesSierra LeoneSingaporeSlovak RepublicSloveniaSmall statesSomaliaSouth AfricaSouth AsiaSouth Asia (IDA & IBRD)South SudanSpainSri LankaSub-Saharan Africa Sub-Saharan Africa (excluding high income)Sub-Saharan Africa (IDA & IBRD countries)SudanSurinameSwazilandSwedenSwitzerlandSyrian Arab RepublicTajikistanTanzaniaThailandTimor-LesteTogoTrinidad and TobagoTunisiaTurkeyTurkmenistanUgandaUkraineUnited Arab EmiratesUnited KingdomUnited StatesUpper middle incomeUruguayUzbekistanVanuatuVenezuela, RBVietnamWest Bank and GazaWorldZimbabwe Timeline:
This timeline shows a graph from 1962 to 2015 of Algeria. No data until 1961. Number of actual observations by date: 54.
Source name:
World Development Indicators
Source organization:
World Bank national accounts data, and OECD National Accounts data files.
Categories, topics:
Economy & Growth
Last updated:
apr 23, 2017
Indicators value changes by year
Minimum:
-41.176
jan 1, 1963
Maximum:
48.052
jan 1, 1968
At the date of observation
Value
Absolute change
Change from previous value
jan 1, 1962
-1.923
-1.923
0.0%
jan 1, 1963
-41.176
-39.253
2.04K%
jan 1, 1964
13.333
+54.51
-132.38%
jan 1, 1965
-20.588
-33.922
-254.41%
jan 1, 1966
3.704
+24.292
-117.99%
jan 1, 1967
-23.762
-27.466
-741.58%
jan 1, 1968
48.052
+71.814
-302.22%
jan 1, 1969
21.053
-26.999
-56.19%
jan 1, 1970
23.913
+2.86
13.59%
jan 1, 1971
25.731
+1.818
7.6%
jan 1, 1972
-1.86
-27.591
-107.23%
jan 1, 1973
17.062
+18.922
-1.02K%
jan 1, 1974
24.291
+7.23
42.38%
jan 1, 1975
37.785
+13.494
55.55%
jan 1, 1976
8.511
-29.274
-77.48%
jan 1, 1977
3.268
-5.243
-61.6%
jan 1, 1978
17.511
+14.243
435.82%
jan 1, 1979
20.108
+2.597
14.83%
jan 1, 1980
-7.175
-27.283
-135.68%
jan 1, 1981
2.254
+9.429
-131.42%
jan 1, 1982
7.978
+5.724
253.88%
jan 1, 1983
1.639
-6.339
-79.46%
jan 1, 1984
4.304
+2.665
162.65%
jan 1, 1985
3.258
-1.045
-24.29%
jan 1, 1986
4.967
+1.709
52.46%
jan 1, 1987
-13.733
-18.701
-376.48%
jan 1, 1988
-20.001
-6.267
45.64%
jan 1, 1989
7.987
+27.988
-139.93%
jan 1, 1990
5.306
-2.681
-33.57%
jan 1, 1991
-4.468
-9.774
-184.22%
jan 1, 1992
-9.211
-4.743
106.15%
jan 1, 1993
-8.294
+0.917
-9.96%
jan 1, 1994
-6.066
+2.228
-26.86%
jan 1, 1995
4.405
+10.471
-172.61%
jan 1, 1996
0.837
-3.568
-81.0%
jan 1, 1997
-3.608
-4.445
-531.2%
jan 1, 1998
-3.873
-0.266
7.36%
jan 1, 1999
20.875
+24.748
-638.92%
jan 1, 2000
-2.059
-22.934
-109.86%
jan 1, 2001
-6.954
-4.894
237.69%
jan 1, 2002
14.883
+21.836
-314.03%
jan 1, 2003
13.061
-1.822
-12.24%
jan 1, 2004
9.38
-3.681
-28.19%
jan 1, 2005
11.237
+1.857
19.8%
jan 1, 2006
7.896
-3.341
-29.73%
jan 1, 2007
4.599
-3.298
-41.76%
jan 1, 2008
6.956
+2.357
51.24%
jan 1, 2009
-2.182
-9.138
-131.37%
jan 1, 2010
27.94
+30.122
-1.38K%
jan 1, 2011
12.02
-15.92
-56.98%
jan 1, 2012
2.9
-9.12
-75.87%
jan 1, 2013
7.2
+4.3
148.28%
jan 1, 2014
8.6
+1.4
19.44%
jan 1, 2015
6.4
-2.2
-25.58%
Ranking of countries by current statistics by years


Comments: