29
/
en
AIzaSyAYiBZKx7MnpbEhh9jyipgxe19OcubqV5w
April 1, 2024
163800
Japan
JPN
true
2
1
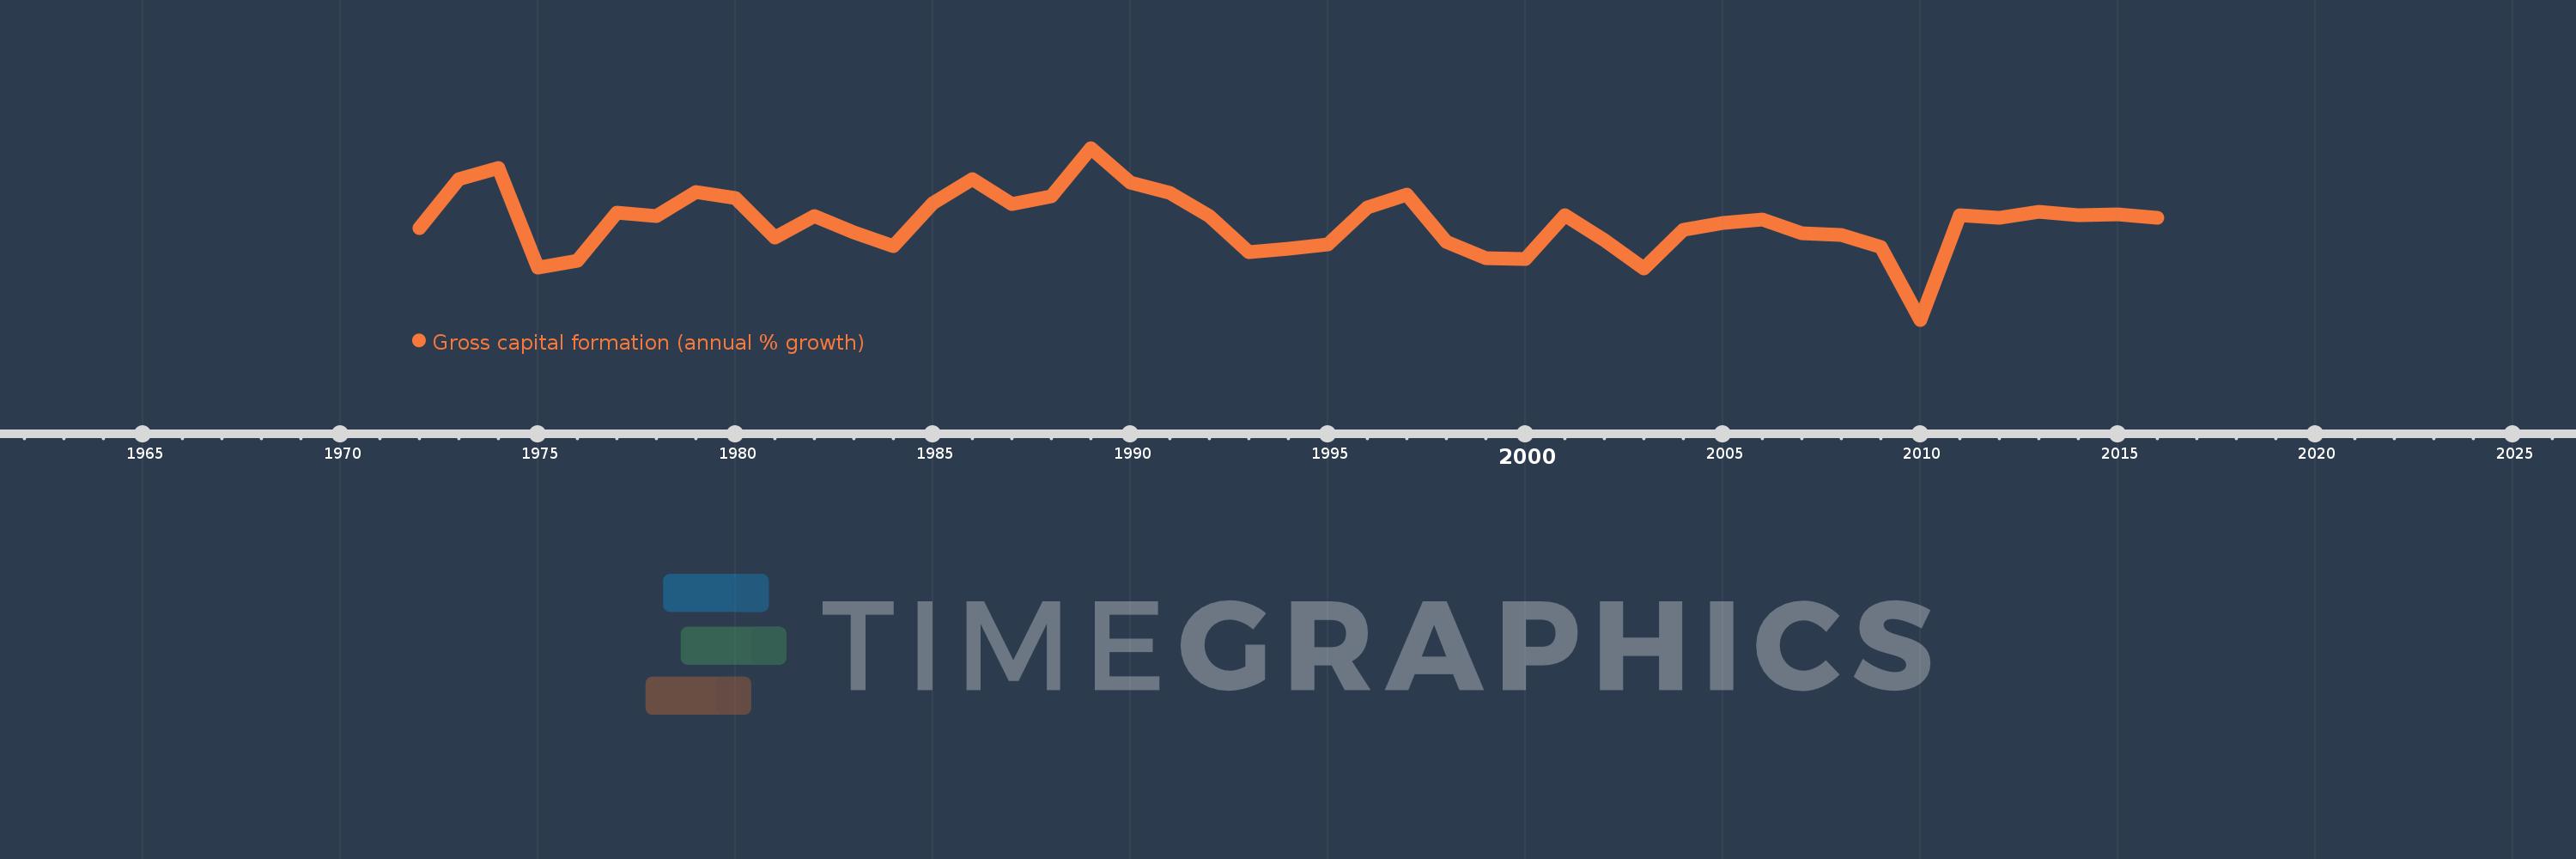
Gross capital formation (annual % growth)
2016,2015,2014,2013,2012,2011,2010,2009,2008,2007,2006,2005,2004,2003,2002,2001,2000,1999,1998,1997,1996,1995,1994,1993,1992,1991,1990,1989,1988,1987,1986,1985,1984,1983,1982,1981,1980,1979,1978,1977,1976,1975,1974,1973,1972
This statistics in other country:
AlbaniaAlgeriaAntigua and BarbudaArab WorldArgentinaArmeniaAustraliaAustriaAzerbaijanBahamas, TheBahrainBangladeshBarbadosBelarusBelgiumBelizeBeninBhutanBoliviaBosnia and HerzegovinaBotswanaBrazilBrunei DarussalamBulgariaBurkina FasoBurundiCabo VerdeCambodiaCameroonCanadaCaribbean small statesCentral Europe and the BalticsChadChileChinaColombiaComorosCongo, Dem. Rep.Congo, Rep.Costa RicaCote d'IvoireCroatiaCubaCyprusCzech RepublicDenmarkDjiboutiDominican RepublicEarly-demographic dividendEast Asia & PacificEast Asia & Pacific (excluding high income)East Asia & Pacific (IDA & IBRD countries)EcuadorEgypt, Arab Rep.El SalvadorEquatorial GuineaEritreaEstoniaEthiopiaEuro areaEurope & Central AsiaEurope & Central Asia (excluding high income)Europe & Central Asia (IDA & IBRD countries)European UnionFijiFinlandFranceGabonGambia, TheGeorgiaGermanyGhanaGreeceGuatemalaGuineaGuinea-BissauHaitiHeavily indebted poor countries (HIPC)High incomeHondurasHong Kong SAR, ChinaHungaryIBRD onlyIcelandIDA & IBRD totalIDA blendIDA onlyIDA totalIndiaIndonesiaIran, Islamic Rep.IrelandIsraelItalyJamaicaJapanJordanKazakhstanKenyaKorea, Rep.KosovoKuwaitKyrgyz RepublicLao PDRLate-demographic dividendLatin America & Caribbean Latin America & Caribbean (excluding high income)Latin America & the Caribbean (IDA & IBRD countries)LatviaLeast developed countries: UN classificationLebanonLiberiaLithuaniaLow & middle incomeLow incomeLower middle incomeLuxembourgMacao SAR, ChinaMacedonia, FYRMadagascarMalawiMalaysiaMaliMaltaMauritaniaMauritiusMexicoMiddle East & North AfricaMiddle East & North Africa (excluding high income)Middle East & North Africa (IDA & IBRD countries)Middle incomeMoldovaMongoliaMontenegroMoroccoMozambiqueNamibiaNepalNetherlandsNew ZealandNicaraguaNigerNigeriaNorth AmericaNorwayOECD membersOmanOther small statesPakistanPanamaPapua New GuineaParaguayPeruPhilippinesPolandPortugalPost-demographic dividendPre-demographic dividendPuerto RicoQatarRomaniaRussian FederationRwandaSaudi ArabiaSenegalSerbiaSeychellesSierra LeoneSingaporeSlovak RepublicSloveniaSmall statesSomaliaSouth AfricaSouth AsiaSouth Asia (IDA & IBRD)South SudanSpainSri LankaSub-Saharan Africa Sub-Saharan Africa (excluding high income)Sub-Saharan Africa (IDA & IBRD countries)SudanSurinameSwazilandSwedenSwitzerlandSyrian Arab RepublicTajikistanTanzaniaThailandTimor-LesteTogoTrinidad and TobagoTunisiaTurkeyTurkmenistanUgandaUkraineUnited Arab EmiratesUnited KingdomUnited StatesUpper middle incomeUruguayUzbekistanVanuatuVenezuela, RBVietnamWest Bank and GazaWorldZimbabwe Timeline:
This timeline shows a graph from 1972 to 2016 of Japan. No data until 1971. Number of actual observations by date: 45.
Source name:
World Development Indicators
Source organization:
World Bank national accounts data, and OECD National Accounts data files.
Categories, topics:
Economy & Growth
Last updated:
apr 23, 2017
Indicators value changes by year
Minimum:
-16.109
jan 1, 2010
Maximum:
15.559
jan 1, 1989
At the date of observation
Value
Absolute change
Change from previous value
jan 1, 1972
0.865
+0.865
0.0%
jan 1, 1973
9.844
+8.98
1.04K%
jan 1, 1974
11.871
+2.027
20.59%
jan 1, 1975
-6.451
-18.322
-154.34%
jan 1, 1976
-5.199
+1.252
-19.4%
jan 1, 1977
3.672
+8.871
-170.63%
jan 1, 1978
3.039
-0.633
-17.24%
jan 1, 1979
7.502
+4.463
146.84%
jan 1, 1980
6.403
-1.099
-14.65%
jan 1, 1981
-0.932
-7.335
-114.55%
jan 1, 1982
2.94
+3.872
-415.5%
jan 1, 1983
-0.077
-3.017
-102.62%
jan 1, 1984
-2.485
-2.408
3.13K%
jan 1, 1985
5.425
+7.91
-318.35%
jan 1, 1986
9.871
+4.446
81.96%
jan 1, 1987
5.18
-4.692
-47.53%
jan 1, 1988
6.648
+1.468
28.35%
jan 1, 1989
15.559
+8.911
134.03%
jan 1, 1990
9.213
-6.346
-40.79%
jan 1, 1991
7.323
-1.89
-20.51%
jan 1, 1992
2.986
-4.337
-59.22%
jan 1, 1993
-3.611
-6.597
-220.93%
jan 1, 1994
-3.06
+0.551
-15.25%
jan 1, 1995
-2.251
+0.809
-26.44%
jan 1, 1996
4.521
+6.772
-300.8%
jan 1, 1997
6.943
+2.422
53.57%
jan 1, 1998
-1.757
-8.7
-125.31%
jan 1, 1999
-4.742
-2.985
169.89%
jan 1, 2000
-4.887
-0.145
3.06%
jan 1, 2001
3.148
+8.035
-164.42%
jan 1, 2002
-1.46
-4.609
-146.39%
jan 1, 2003
-6.621
-5.16
353.35%
jan 1, 2004
0.516
+7.137
-107.79%
jan 1, 2005
1.805
+1.29
249.96%
jan 1, 2006
2.337
+0.531
29.43%
jan 1, 2007
-0.122
-2.459
-105.24%
jan 1, 2008
-0.514
-0.391
319.66%
jan 1, 2009
-2.757
-2.243
436.61%
jan 1, 2010
-16.109
-13.352
484.34%
jan 1, 2011
3.089
+19.198
-119.18%
jan 1, 2012
2.632
-0.458
-14.82%
jan 1, 2013
3.729
+1.097
41.7%
jan 1, 2014
3.173
-0.556
-14.9%
jan 1, 2015
3.258
+0.085
2.69%
jan 1, 2016
2.609
-0.65
-19.94%
Ranking of countries by current statistics by years


Comments: