29
/
en
AIzaSyAYiBZKx7MnpbEhh9jyipgxe19OcubqV5w
April 1, 2024
51883
North America
NAC
false
2
1
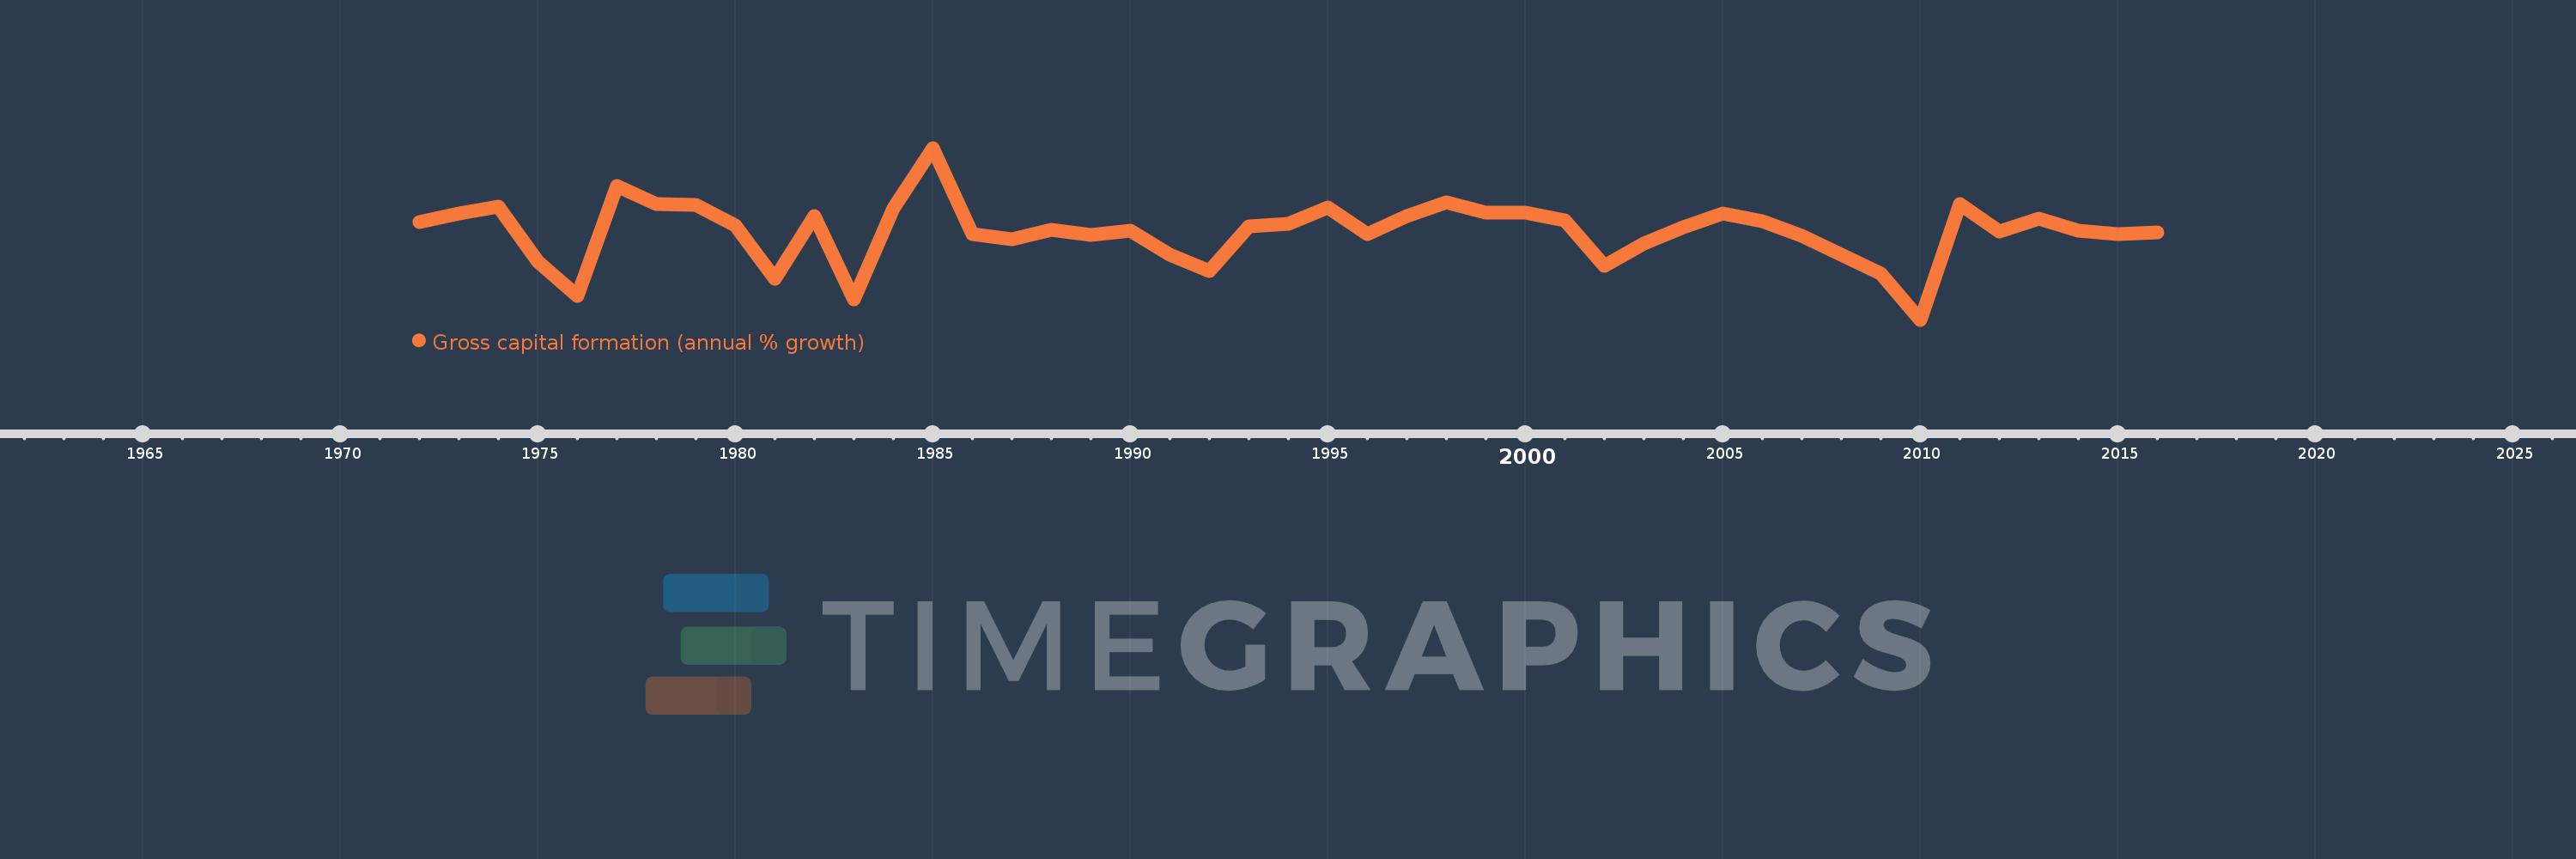
Gross capital formation (annual % growth)
2016,2015,2014,2013,2012,2011,2010,2009,2008,2007,2006,2005,2004,2003,2002,2001,2000,1999,1998,1997,1996,1995,1994,1993,1992,1991,1990,1989,1988,1987,1986,1985,1984,1983,1982,1981,1980,1979,1978,1977,1976,1975,1974,1973,1972
This statistics in other country:
AlbaniaAlgeriaAntigua and BarbudaArab WorldArgentinaArmeniaAustraliaAustriaAzerbaijanBahamas, TheBahrainBangladeshBarbadosBelarusBelgiumBelizeBeninBhutanBoliviaBosnia and HerzegovinaBotswanaBrazilBrunei DarussalamBulgariaBurkina FasoBurundiCabo VerdeCambodiaCameroonCanadaCaribbean small statesCentral Europe and the BalticsChadChileChinaColombiaComorosCongo, Dem. Rep.Congo, Rep.Costa RicaCote d'IvoireCroatiaCubaCyprusCzech RepublicDenmarkDjiboutiDominican RepublicEarly-demographic dividendEast Asia & PacificEast Asia & Pacific (excluding high income)East Asia & Pacific (IDA & IBRD countries)EcuadorEgypt, Arab Rep.El SalvadorEquatorial GuineaEritreaEstoniaEthiopiaEuro areaEurope & Central AsiaEurope & Central Asia (excluding high income)Europe & Central Asia (IDA & IBRD countries)European UnionFijiFinlandFranceGabonGambia, TheGeorgiaGermanyGhanaGreeceGuatemalaGuineaGuinea-BissauHaitiHeavily indebted poor countries (HIPC)High incomeHondurasHong Kong SAR, ChinaHungaryIBRD onlyIcelandIDA & IBRD totalIDA blendIDA onlyIDA totalIndiaIndonesiaIran, Islamic Rep.IrelandIsraelItalyJamaicaJapanJordanKazakhstanKenyaKorea, Rep.KosovoKuwaitKyrgyz RepublicLao PDRLate-demographic dividendLatin America & Caribbean Latin America & Caribbean (excluding high income)Latin America & the Caribbean (IDA & IBRD countries)LatviaLeast developed countries: UN classificationLebanonLiberiaLithuaniaLow & middle incomeLow incomeLower middle incomeLuxembourgMacao SAR, ChinaMacedonia, FYRMadagascarMalawiMalaysiaMaliMaltaMauritaniaMauritiusMexicoMiddle East & North AfricaMiddle East & North Africa (excluding high income)Middle East & North Africa (IDA & IBRD countries)Middle incomeMoldovaMongoliaMontenegroMoroccoMozambiqueNamibiaNepalNetherlandsNew ZealandNicaraguaNigerNigeriaNorth AmericaNorwayOECD membersOmanOther small statesPakistanPanamaPapua New GuineaParaguayPeruPhilippinesPolandPortugalPost-demographic dividendPre-demographic dividendPuerto RicoQatarRomaniaRussian FederationRwandaSaudi ArabiaSenegalSerbiaSeychellesSierra LeoneSingaporeSlovak RepublicSloveniaSmall statesSomaliaSouth AfricaSouth AsiaSouth Asia (IDA & IBRD)South SudanSpainSri LankaSub-Saharan Africa Sub-Saharan Africa (excluding high income)Sub-Saharan Africa (IDA & IBRD countries)SudanSurinameSwazilandSwedenSwitzerlandSyrian Arab RepublicTajikistanTanzaniaThailandTimor-LesteTogoTrinidad and TobagoTunisiaTurkeyTurkmenistanUgandaUkraineUnited Arab EmiratesUnited KingdomUnited StatesUpper middle incomeUruguayUzbekistanVanuatuVenezuela, RBVietnamWest Bank and GazaWorldZimbabwe Timeline:
This timeline shows a graph from 1972 to 2016 of North America. No data until 1971. Number of actual observations by date: 45.
Source name:
World Development Indicators
Source organization:
World Bank national accounts data, and OECD National Accounts data files.
Categories, topics:
Economy & Growth
Last updated:
apr 23, 2017
Indicators value changes by year
Minimum:
-16.54
jan 1, 2010
Maximum:
22.563
jan 1, 1985
At the date of observation
Value
Absolute change
Change from previous value
jan 1, 1972
5.737
+5.737
0.0%
jan 1, 1973
7.647
+1.91
33.3%
jan 1, 1974
9.285
+1.638
21.42%
jan 1, 1975
-3.255
-12.54
-135.06%
jan 1, 1976
-11.091
-7.837
240.76%
jan 1, 1977
13.871
+24.963
-225.06%
jan 1, 1978
9.741
-4.13
-29.78%
jan 1, 1979
9.589
-0.152
-1.56%
jan 1, 1980
4.827
-4.762
-49.66%
jan 1, 1981
-7.23
-12.057
-249.79%
jan 1, 1982
6.962
+14.192
-196.3%
jan 1, 1983
-11.881
-18.844
-270.65%
jan 1, 1984
8.724
+20.605
-173.42%
jan 1, 1985
22.563
+13.839
158.63%
jan 1, 1986
2.978
-19.585
-86.8%
jan 1, 1987
1.859
-1.119
-37.58%
jan 1, 1988
3.979
+2.12
114.08%
jan 1, 1989
2.693
-1.285
-32.31%
jan 1, 1990
3.793
+1.099
40.82%
jan 1, 1991
-1.794
-5.587
-147.3%
jan 1, 1992
-5.495
-3.701
206.32%
jan 1, 1993
4.636
+10.131
-184.36%
jan 1, 1994
5.228
+0.592
12.78%
jan 1, 1995
9.032
+3.804
72.76%
jan 1, 1996
2.907
-6.125
-67.81%
jan 1, 1997
6.968
+4.061
139.68%
jan 1, 1998
10.241
+3.273
46.96%
jan 1, 1999
7.759
-2.482
-24.23%
jan 1, 2000
7.781
+0.022
0.28%
jan 1, 2001
6.132
-1.649
-21.2%
jan 1, 2002
-4.239
-10.371
-169.13%
jan 1, 2003
0.769
+5.008
-118.13%
jan 1, 2004
4.462
+3.694
480.54%
jan 1, 2005
7.579
+3.117
69.85%
jan 1, 2006
5.836
-1.743
-23.0%
jan 1, 2007
2.653
-3.183
-54.54%
jan 1, 2008
-1.691
-4.344
-163.74%
jan 1, 2009
-6.063
-4.372
258.56%
jan 1, 2010
-16.54
-10.477
172.81%
jan 1, 2011
9.88
+26.42
-159.74%
jan 1, 2012
3.491
-6.389
-64.66%
jan 1, 2013
6.498
+3.007
86.12%
jan 1, 2014
3.697
-2.801
-43.11%
jan 1, 2015
2.915
-0.782
-21.15%
jan 1, 2016
3.369
+0.454
15.56%
Ranking of countries by current statistics by years


Comments: