29
/
en
AIzaSyAYiBZKx7MnpbEhh9jyipgxe19OcubqV5w
April 1, 2024
84133
Benin
BEN
true
2
1
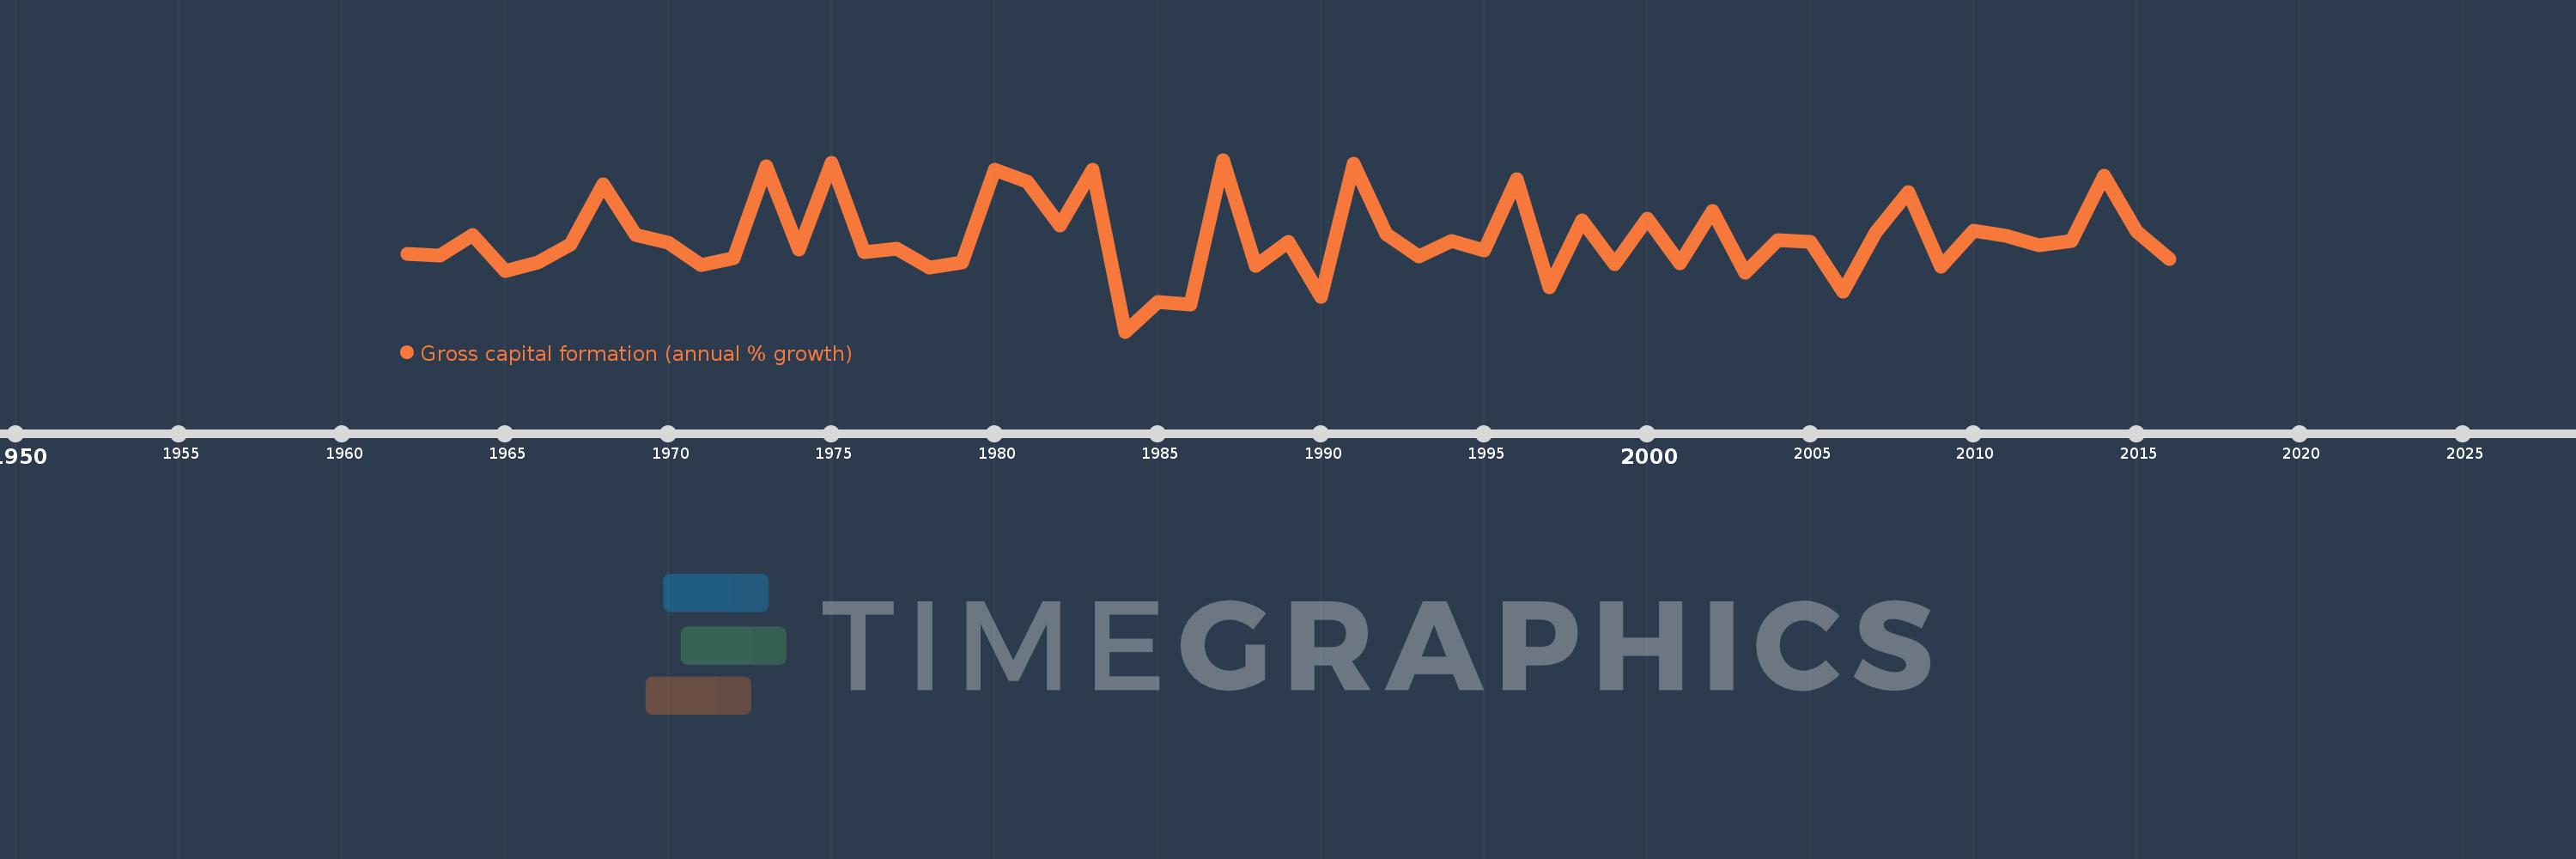
Gross capital formation (annual % growth)
2016,2015,2014,2013,2012,2011,2010,2009,2008,2007,2006,2005,2004,2003,2002,2001,2000,1999,1998,1997,1996,1995,1994,1993,1992,1991,1990,1989,1988,1987,1986,1985,1984,1983,1982,1981,1980,1979,1978,1977,1976,1975,1974,1973,1972,1971,1970,1969,1968,1967,1966,1965,1964,1963,1962
This statistics in other country:
AlbaniaAlgeriaAntigua and BarbudaArab WorldArgentinaArmeniaAustraliaAustriaAzerbaijanBahamas, TheBahrainBangladeshBarbadosBelarusBelgiumBelizeBeninBhutanBoliviaBosnia and HerzegovinaBotswanaBrazilBrunei DarussalamBulgariaBurkina FasoBurundiCabo VerdeCambodiaCameroonCanadaCaribbean small statesCentral Europe and the BalticsChadChileChinaColombiaComorosCongo, Dem. Rep.Congo, Rep.Costa RicaCote d'IvoireCroatiaCubaCyprusCzech RepublicDenmarkDjiboutiDominican RepublicEarly-demographic dividendEast Asia & PacificEast Asia & Pacific (excluding high income)East Asia & Pacific (IDA & IBRD countries)EcuadorEgypt, Arab Rep.El SalvadorEquatorial GuineaEritreaEstoniaEthiopiaEuro areaEurope & Central AsiaEurope & Central Asia (excluding high income)Europe & Central Asia (IDA & IBRD countries)European UnionFijiFinlandFranceGabonGambia, TheGeorgiaGermanyGhanaGreeceGuatemalaGuineaGuinea-BissauHaitiHeavily indebted poor countries (HIPC)High incomeHondurasHong Kong SAR, ChinaHungaryIBRD onlyIcelandIDA & IBRD totalIDA blendIDA onlyIDA totalIndiaIndonesiaIran, Islamic Rep.IrelandIsraelItalyJamaicaJapanJordanKazakhstanKenyaKorea, Rep.KosovoKuwaitKyrgyz RepublicLao PDRLate-demographic dividendLatin America & Caribbean Latin America & Caribbean (excluding high income)Latin America & the Caribbean (IDA & IBRD countries)LatviaLeast developed countries: UN classificationLebanonLiberiaLithuaniaLow & middle incomeLow incomeLower middle incomeLuxembourgMacao SAR, ChinaMacedonia, FYRMadagascarMalawiMalaysiaMaliMaltaMauritaniaMauritiusMexicoMiddle East & North AfricaMiddle East & North Africa (excluding high income)Middle East & North Africa (IDA & IBRD countries)Middle incomeMoldovaMongoliaMontenegroMoroccoMozambiqueNamibiaNepalNetherlandsNew ZealandNicaraguaNigerNigeriaNorth AmericaNorwayOECD membersOmanOther small statesPakistanPanamaPapua New GuineaParaguayPeruPhilippinesPolandPortugalPost-demographic dividendPre-demographic dividendPuerto RicoQatarRomaniaRussian FederationRwandaSaudi ArabiaSenegalSerbiaSeychellesSierra LeoneSingaporeSlovak RepublicSloveniaSmall statesSomaliaSouth AfricaSouth AsiaSouth Asia (IDA & IBRD)South SudanSpainSri LankaSub-Saharan Africa Sub-Saharan Africa (excluding high income)Sub-Saharan Africa (IDA & IBRD countries)SudanSurinameSwazilandSwedenSwitzerlandSyrian Arab RepublicTajikistanTanzaniaThailandTimor-LesteTogoTrinidad and TobagoTunisiaTurkeyTurkmenistanUgandaUkraineUnited Arab EmiratesUnited KingdomUnited StatesUpper middle incomeUruguayUzbekistanVanuatuVenezuela, RBVietnamWest Bank and GazaWorldZimbabwe Timeline:
This timeline shows a graph from 1962 to 2016 of Benin. No data until 1961. Number of actual observations by date: 55.
Source name:
World Development Indicators
Source organization:
World Bank national accounts data, and OECD National Accounts data files.
Categories, topics:
Economy & Growth
Last updated:
apr 23, 2017
Indicators value changes by year
Minimum:
-41.436
jan 1, 1984
Maximum:
48.095
jan 1, 1987
At the date of observation
Value
Absolute change
Change from previous value
jan 1, 1962
-0.877
-0.877
0.0%
jan 1, 1963
-1.77
-0.893
101.83%
jan 1, 1964
9.009
+10.778
-609.09%
jan 1, 1965
-9.917
-18.926
-210.09%
jan 1, 1966
-5.496
+4.422
-44.59%
jan 1, 1967
3.884
+9.38
-170.68%
jan 1, 1968
35.513
+31.629
814.32%
jan 1, 1969
8.966
-26.547
-74.75%
jan 1, 1970
5.063
-3.903
-43.53%
jan 1, 1971
-6.627
-11.69
-230.89%
jan 1, 1972
-3.014
+3.613
-54.52%
jan 1, 1973
44.853
+47.867
-1.59K%
jan 1, 1974
1.289
-43.564
-97.13%
jan 1, 1975
46.492
+45.203
3.51K%
jan 1, 1976
0.079
-46.413
-99.83%
jan 1, 1977
1.893
+1.814
2.3K%
jan 1, 1978
-7.974
-9.868
-521.16%
jan 1, 1979
-5.58
+2.394
-30.02%
jan 1, 1980
43.154
+48.735
-873.31%
jan 1, 1981
36.68
-6.474
-15.0%
jan 1, 1982
13.798
-22.882
-62.38%
jan 1, 1983
43.095
+29.297
212.33%
jan 1, 1984
-41.436
-84.531
-196.15%
jan 1, 1985
-26.181
+15.255
-36.82%
jan 1, 1986
-27.336
-1.154
4.41%
jan 1, 1987
48.095
+75.431
-275.94%
jan 1, 1988
-7.235
-55.33
-115.04%
jan 1, 1989
5.199
+12.434
-171.87%
jan 1, 1990
-23.301
-28.5
-548.15%
jan 1, 1991
46.214
+69.514
-298.34%
jan 1, 1992
9.364
-36.849
-79.74%
jan 1, 1993
-2.428
-11.792
-125.93%
jan 1, 1994
5.8
+8.228
-338.91%
jan 1, 1995
0.732
-5.068
-87.38%
jan 1, 1996
38.133
+37.401
5.11K%
jan 1, 1997
-18.278
-56.411
-147.93%
jan 1, 1998
16.712
+34.99
-191.43%
jan 1, 1999
-6.146
-22.858
-136.78%
jan 1, 2000
17.554
+23.7
-385.59%
jan 1, 2001
-5.963
-23.517
-133.97%
jan 1, 2002
21.373
+27.336
-458.4%
jan 1, 2003
-10.995
-32.368
-151.45%
jan 1, 2004
6.428
+17.423
-158.46%
jan 1, 2005
5.271
-1.156
-17.99%
jan 1, 2006
-20.842
-26.114
-495.38%
jan 1, 2007
10.075
+30.918
-148.34%
jan 1, 2008
31.113
+21.038
208.8%
jan 1, 2009
-7.489
-38.602
-124.07%
jan 1, 2010
11.296
+18.785
-250.83%
jan 1, 2011
8.331
-2.965
-26.25%
jan 1, 2012
3.656
-4.675
-56.11%
jan 1, 2013
5.862
+2.206
60.33%
jan 1, 2014
39.855
+33.993
579.84%
jan 1, 2015
10.565
-29.291
-73.49%
jan 1, 2016
-3.781
-14.345
-135.79%
Ranking of countries by current statistics by years


Comments: