29
/
en
AIzaSyAYiBZKx7MnpbEhh9jyipgxe19OcubqV5w
April 1, 2024
223608
Philippines
PHL
true
2
1
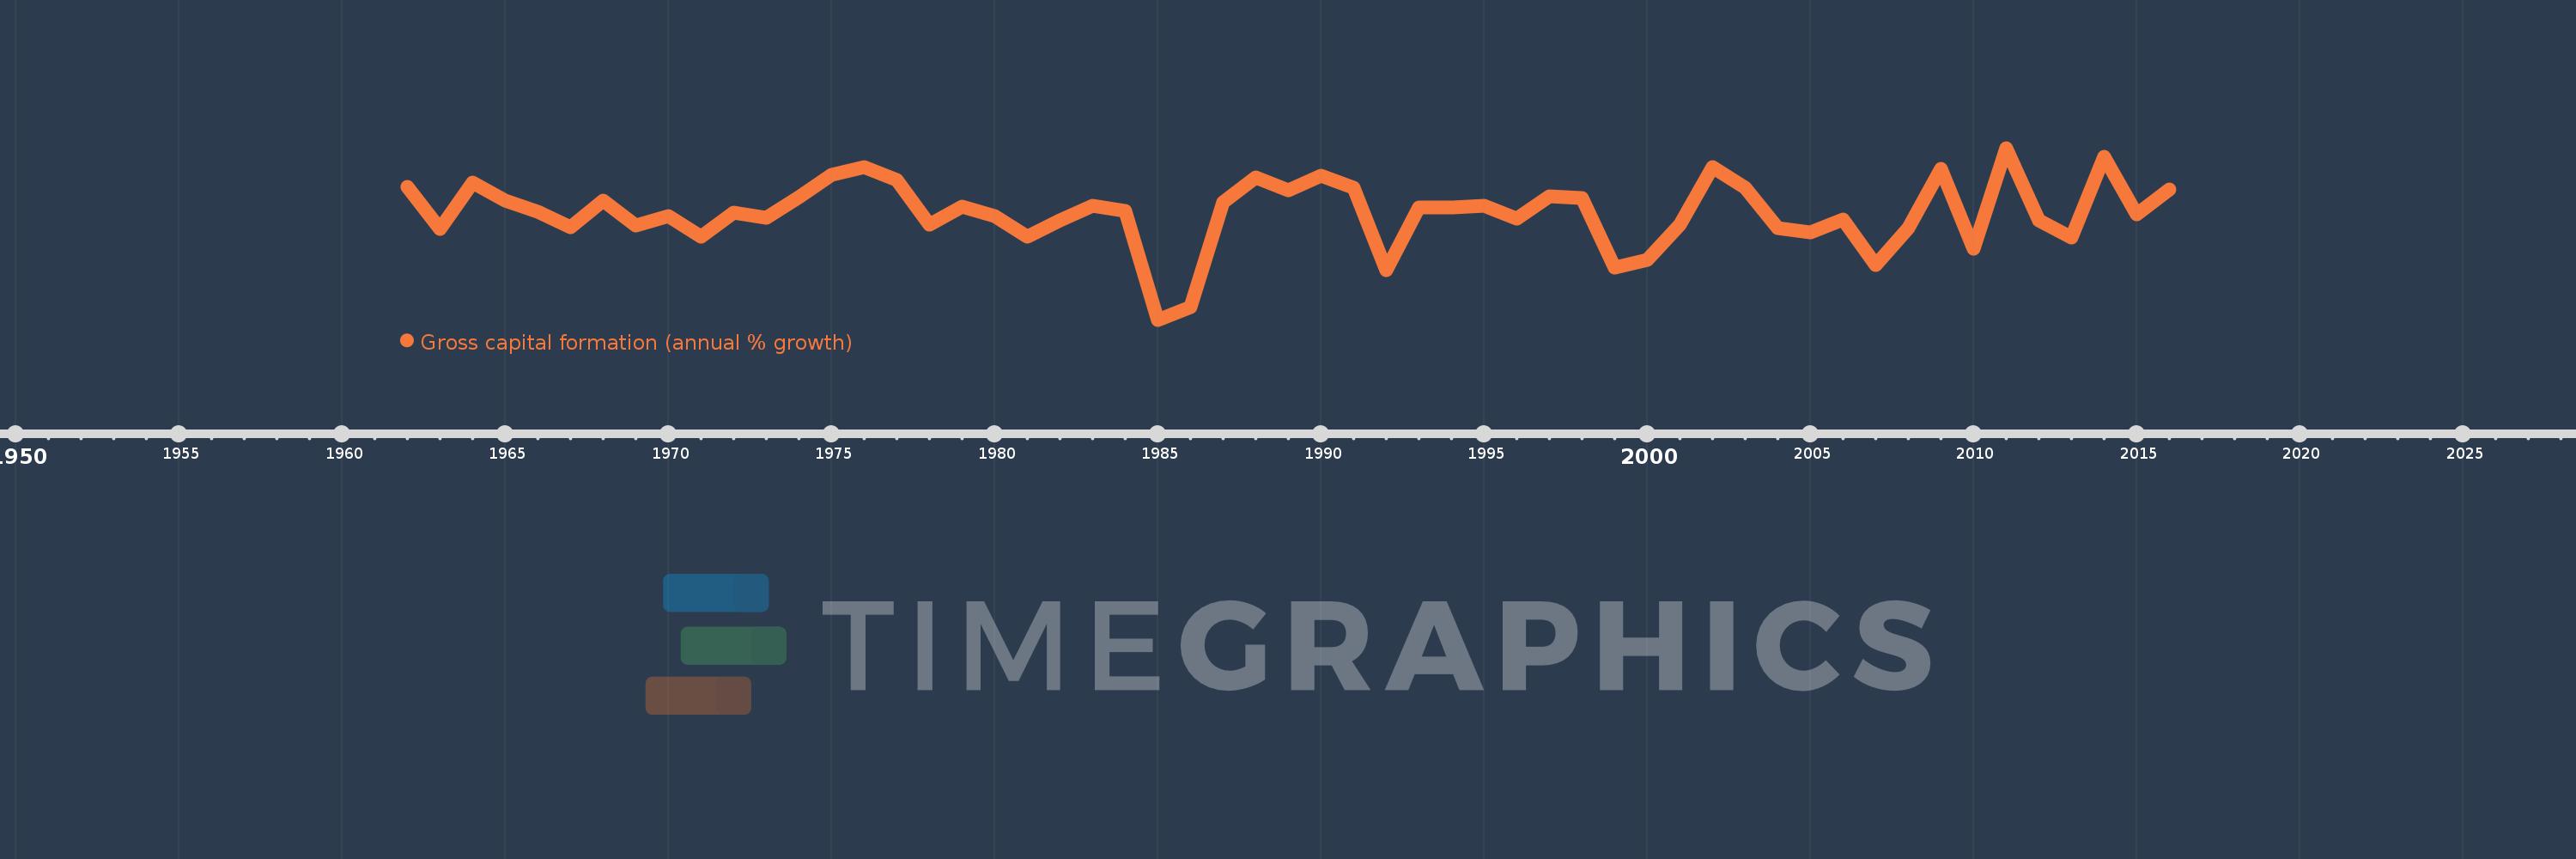
Gross capital formation (annual % growth)
2016,2015,2014,2013,2012,2011,2010,2009,2008,2007,2006,2005,2004,2003,2002,2001,2000,1999,1998,1997,1996,1995,1994,1993,1992,1991,1990,1989,1988,1987,1986,1985,1984,1983,1982,1981,1980,1979,1978,1977,1976,1975,1974,1973,1972,1971,1970,1969,1968,1967,1966,1965,1964,1963,1962
This statistics in other country:
AlbaniaAlgeriaAntigua and BarbudaArab WorldArgentinaArmeniaAustraliaAustriaAzerbaijanBahamas, TheBahrainBangladeshBarbadosBelarusBelgiumBelizeBeninBhutanBoliviaBosnia and HerzegovinaBotswanaBrazilBrunei DarussalamBulgariaBurkina FasoBurundiCabo VerdeCambodiaCameroonCanadaCaribbean small statesCentral Europe and the BalticsChadChileChinaColombiaComorosCongo, Dem. Rep.Congo, Rep.Costa RicaCote d'IvoireCroatiaCubaCyprusCzech RepublicDenmarkDjiboutiDominican RepublicEarly-demographic dividendEast Asia & PacificEast Asia & Pacific (excluding high income)East Asia & Pacific (IDA & IBRD countries)EcuadorEgypt, Arab Rep.El SalvadorEquatorial GuineaEritreaEstoniaEthiopiaEuro areaEurope & Central AsiaEurope & Central Asia (excluding high income)Europe & Central Asia (IDA & IBRD countries)European UnionFijiFinlandFranceGabonGambia, TheGeorgiaGermanyGhanaGreeceGuatemalaGuineaGuinea-BissauHaitiHeavily indebted poor countries (HIPC)High incomeHondurasHong Kong SAR, ChinaHungaryIBRD onlyIcelandIDA & IBRD totalIDA blendIDA onlyIDA totalIndiaIndonesiaIran, Islamic Rep.IrelandIsraelItalyJamaicaJapanJordanKazakhstanKenyaKorea, Rep.KosovoKuwaitKyrgyz RepublicLao PDRLate-demographic dividendLatin America & Caribbean Latin America & Caribbean (excluding high income)Latin America & the Caribbean (IDA & IBRD countries)LatviaLeast developed countries: UN classificationLebanonLiberiaLithuaniaLow & middle incomeLow incomeLower middle incomeLuxembourgMacao SAR, ChinaMacedonia, FYRMadagascarMalawiMalaysiaMaliMaltaMauritaniaMauritiusMexicoMiddle East & North AfricaMiddle East & North Africa (excluding high income)Middle East & North Africa (IDA & IBRD countries)Middle incomeMoldovaMongoliaMontenegroMoroccoMozambiqueNamibiaNepalNetherlandsNew ZealandNicaraguaNigerNigeriaNorth AmericaNorwayOECD membersOmanOther small statesPakistanPanamaPapua New GuineaParaguayPeruPhilippinesPolandPortugalPost-demographic dividendPre-demographic dividendPuerto RicoQatarRomaniaRussian FederationRwandaSaudi ArabiaSenegalSerbiaSeychellesSierra LeoneSingaporeSlovak RepublicSloveniaSmall statesSomaliaSouth AfricaSouth AsiaSouth Asia (IDA & IBRD)South SudanSpainSri LankaSub-Saharan Africa Sub-Saharan Africa (excluding high income)Sub-Saharan Africa (IDA & IBRD countries)SudanSurinameSwazilandSwedenSwitzerlandSyrian Arab RepublicTajikistanTanzaniaThailandTimor-LesteTogoTrinidad and TobagoTunisiaTurkeyTurkmenistanUgandaUkraineUnited Arab EmiratesUnited KingdomUnited StatesUpper middle incomeUruguayUzbekistanVanuatuVenezuela, RBVietnamWest Bank and GazaWorldZimbabwe Timeline:
This timeline shows a graph from 1962 to 2016 of Philippines. No data until 1961. Number of actual observations by date: 55.
Source name:
World Development Indicators
Source organization:
World Bank national accounts data, and OECD National Accounts data files.
Categories, topics:
Economy & Growth
Last updated:
apr 23, 2017
Indicators value changes by year
Minimum:
-36.987
jan 1, 1985
Maximum:
31.614
jan 1, 2011
At the date of observation
Value
Absolute change
Change from previous value
jan 1, 1962
16.101
+16.101
0.0%
jan 1, 1963
-0.586
-16.688
-103.64%
jan 1, 1964
17.888
+18.475
-3.15K%
jan 1, 1965
10.539
-7.35
-41.09%
jan 1, 1966
6.184
-4.355
-41.32%
jan 1, 1967
0.065
-6.119
-98.95%
jan 1, 1968
10.476
+10.411
16.06K%
jan 1, 1969
0.698
-9.778
-93.34%
jan 1, 1970
4.53
+3.832
549.13%
jan 1, 1971
-3.929
-8.459
-186.74%
jan 1, 1972
5.75
+9.679
-246.33%
jan 1, 1973
3.631
-2.118
-36.84%
jan 1, 1974
11.849
+8.218
226.3%
jan 1, 1975
20.813
+8.964
75.65%
jan 1, 1976
24.082
+3.269
15.71%
jan 1, 1977
18.866
-5.216
-21.66%
jan 1, 1978
0.972
-17.893
-94.85%
jan 1, 1979
8.093
+7.121
732.31%
jan 1, 1980
4.356
-3.737
-46.18%
jan 1, 1981
-3.703
-8.059
-185.01%
jan 1, 1982
2.832
+6.535
-176.48%
jan 1, 1983
8.419
+5.586
197.24%
jan 1, 1984
6.4
-2.019
-23.98%
jan 1, 1985
-36.987
-43.388
-677.93%
jan 1, 1986
-31.854
+5.134
-13.88%
jan 1, 1987
10.06
+41.914
-131.58%
jan 1, 1988
19.694
+9.634
95.77%
jan 1, 1989
14.688
-5.007
-25.42%
jan 1, 1990
20.45
+5.763
39.23%
jan 1, 1991
15.834
-4.617
-22.58%
jan 1, 1992
-17.29
-33.124
-209.2%
jan 1, 1993
7.833
+25.124
-145.3%
jan 1, 1994
7.873
+0.04
0.52%
jan 1, 1995
8.654
+0.781
9.91%
jan 1, 1996
3.503
-5.151
-59.52%
jan 1, 1997
12.456
+8.953
255.54%
jan 1, 1998
11.695
-0.76
-6.11%
jan 1, 1999
-16.276
-27.972
-239.17%
jan 1, 2000
-13.067
+3.209
-19.72%
jan 1, 2001
1.097
+14.164
-108.39%
jan 1, 2002
23.975
+22.879
2.09K%
jan 1, 2003
15.663
-8.312
-34.67%
jan 1, 2004
-0.448
-16.111
-102.86%
jan 1, 2005
-2.236
-1.788
399.43%
jan 1, 2006
2.958
+5.193
-232.3%
jan 1, 2007
-15.122
-18.08
-611.27%
jan 1, 2008
-0.472
+14.651
-96.88%
jan 1, 2009
23.359
+23.831
-5.05K%
jan 1, 2010
-8.68
-32.039
-137.16%
jan 1, 2011
31.614
+40.294
-464.24%
jan 1, 2012
2.808
-28.807
-91.12%
jan 1, 2013
-4.287
-7.095
-252.68%
jan 1, 2014
27.945
+32.232
-751.88%
jan 1, 2015
5.245
-22.699
-81.23%
jan 1, 2016
15.106
+9.861
187.98%
Ranking of countries by current statistics by years


Comments: