29
/
en
AIzaSyAYiBZKx7MnpbEhh9jyipgxe19OcubqV5w
April 1, 2024
153583
Iceland
ISL
true
2
1
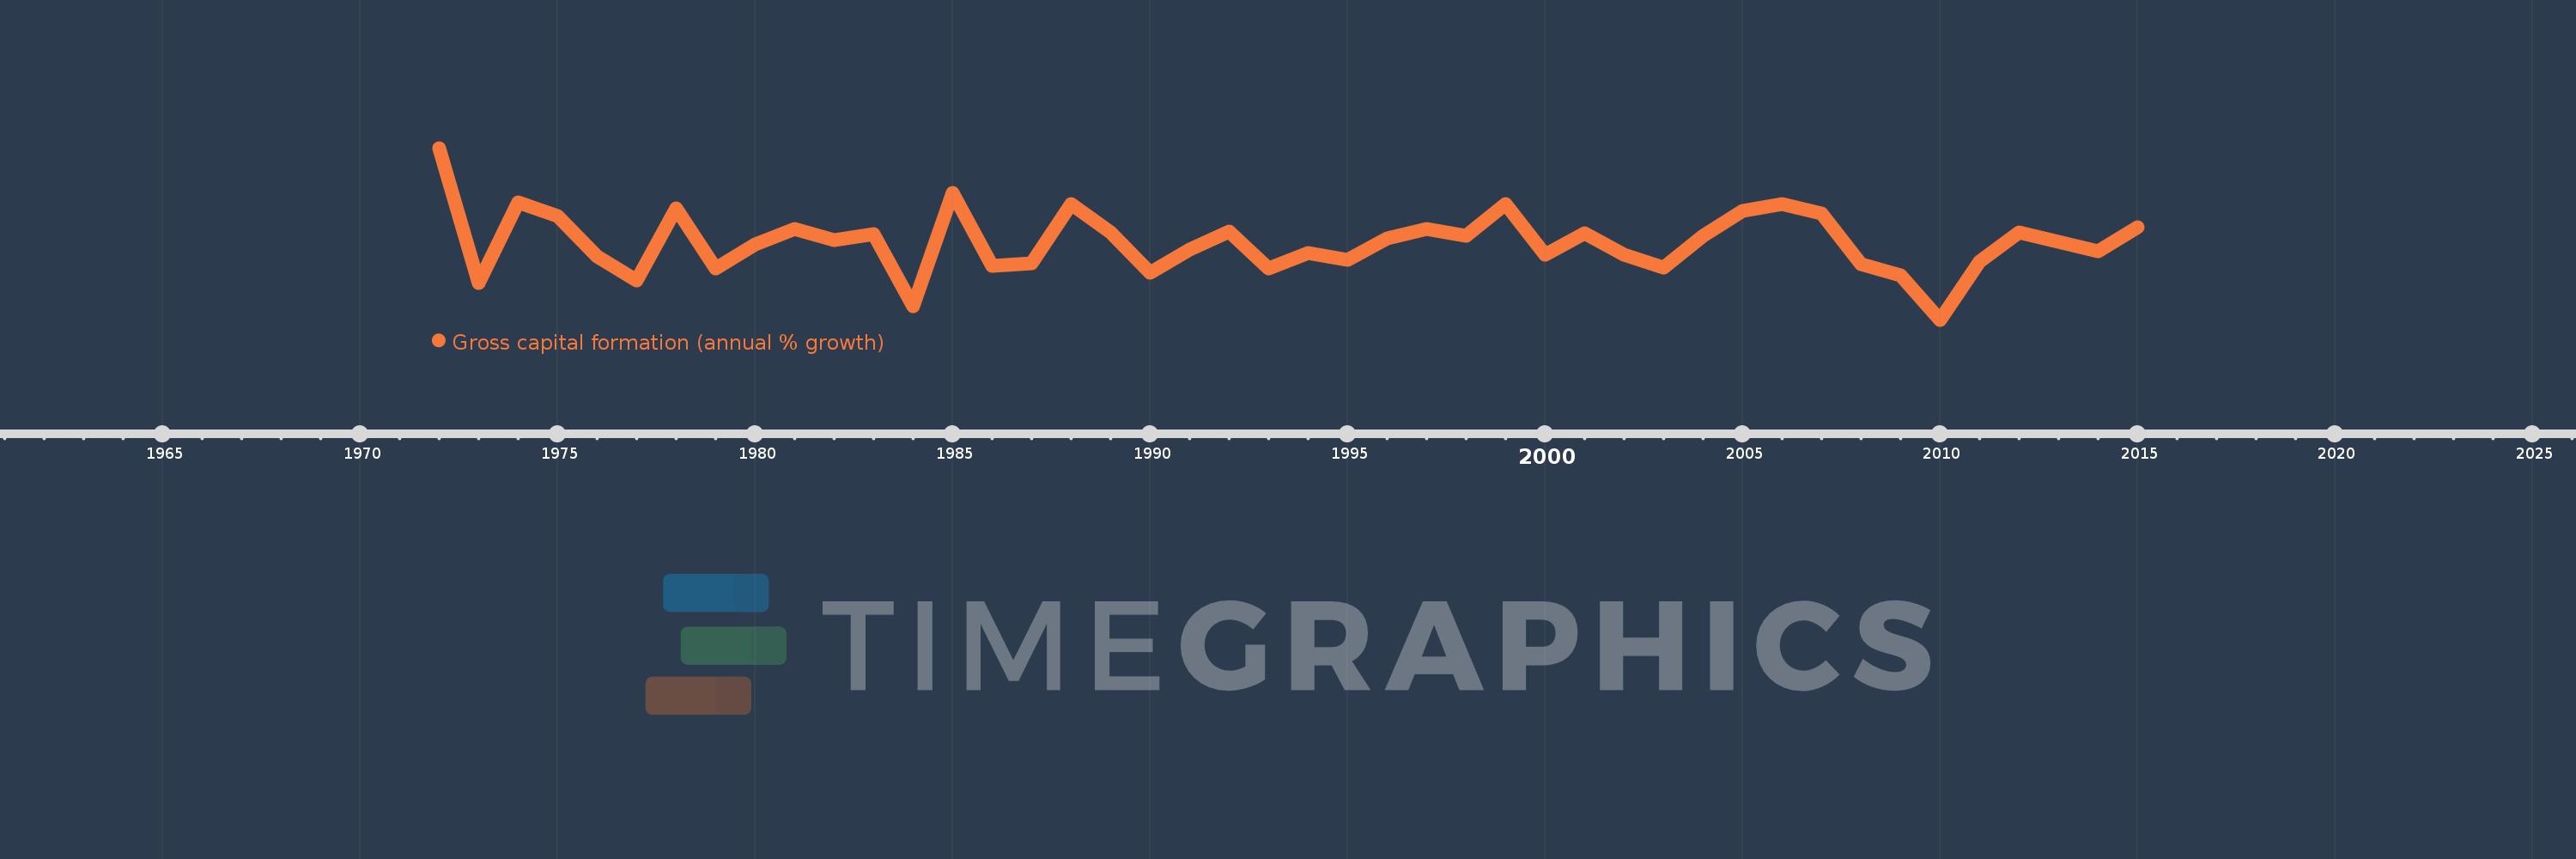
Gross capital formation (annual % growth)
2015,2014,2013,2012,2011,2010,2009,2008,2007,2006,2005,2004,2003,2002,2001,2000,1999,1998,1997,1996,1995,1994,1993,1992,1991,1990,1989,1988,1987,1986,1985,1984,1983,1982,1981,1980,1979,1978,1977,1976,1975,1974,1973,1972
This statistics in other country:
AlbaniaAlgeriaAntigua and BarbudaArab WorldArgentinaArmeniaAustraliaAustriaAzerbaijanBahamas, TheBahrainBangladeshBarbadosBelarusBelgiumBelizeBeninBhutanBoliviaBosnia and HerzegovinaBotswanaBrazilBrunei DarussalamBulgariaBurkina FasoBurundiCabo VerdeCambodiaCameroonCanadaCaribbean small statesCentral Europe and the BalticsChadChileChinaColombiaComorosCongo, Dem. Rep.Congo, Rep.Costa RicaCote d'IvoireCroatiaCubaCyprusCzech RepublicDenmarkDjiboutiDominican RepublicEarly-demographic dividendEast Asia & PacificEast Asia & Pacific (excluding high income)East Asia & Pacific (IDA & IBRD countries)EcuadorEgypt, Arab Rep.El SalvadorEquatorial GuineaEritreaEstoniaEthiopiaEuro areaEurope & Central AsiaEurope & Central Asia (excluding high income)Europe & Central Asia (IDA & IBRD countries)European UnionFijiFinlandFranceGabonGambia, TheGeorgiaGermanyGhanaGreeceGuatemalaGuineaGuinea-BissauHaitiHeavily indebted poor countries (HIPC)High incomeHondurasHong Kong SAR, ChinaHungaryIBRD onlyIcelandIDA & IBRD totalIDA blendIDA onlyIDA totalIndiaIndonesiaIran, Islamic Rep.IrelandIsraelItalyJamaicaJapanJordanKazakhstanKenyaKorea, Rep.KosovoKuwaitKyrgyz RepublicLao PDRLate-demographic dividendLatin America & Caribbean Latin America & Caribbean (excluding high income)Latin America & the Caribbean (IDA & IBRD countries)LatviaLeast developed countries: UN classificationLebanonLiberiaLithuaniaLow & middle incomeLow incomeLower middle incomeLuxembourgMacao SAR, ChinaMacedonia, FYRMadagascarMalawiMalaysiaMaliMaltaMauritaniaMauritiusMexicoMiddle East & North AfricaMiddle East & North Africa (excluding high income)Middle East & North Africa (IDA & IBRD countries)Middle incomeMoldovaMongoliaMontenegroMoroccoMozambiqueNamibiaNepalNetherlandsNew ZealandNicaraguaNigerNigeriaNorth AmericaNorwayOECD membersOmanOther small statesPakistanPanamaPapua New GuineaParaguayPeruPhilippinesPolandPortugalPost-demographic dividendPre-demographic dividendPuerto RicoQatarRomaniaRussian FederationRwandaSaudi ArabiaSenegalSerbiaSeychellesSierra LeoneSingaporeSlovak RepublicSloveniaSmall statesSomaliaSouth AfricaSouth AsiaSouth Asia (IDA & IBRD)South SudanSpainSri LankaSub-Saharan Africa Sub-Saharan Africa (excluding high income)Sub-Saharan Africa (IDA & IBRD countries)SudanSurinameSwazilandSwedenSwitzerlandSyrian Arab RepublicTajikistanTanzaniaThailandTimor-LesteTogoTrinidad and TobagoTunisiaTurkeyTurkmenistanUgandaUkraineUnited Arab EmiratesUnited KingdomUnited StatesUpper middle incomeUruguayUzbekistanVanuatuVenezuela, RBVietnamWest Bank and GazaWorldZimbabwe Timeline:
This timeline shows a graph from 1972 to 2015 of Iceland. No data until 1971. Number of actual observations by date: 44.
Source name:
World Development Indicators
Source organization:
World Bank national accounts data, and OECD National Accounts data files.
Categories, topics:
Economy & Growth
Last updated:
apr 23, 2017
Indicators value changes by year
Minimum:
-49.095
jan 1, 2010
Maximum:
70.649
jan 1, 1972
At the date of observation
Value
Absolute change
Change from previous value
jan 1, 1972
70.649
+70.649
0.0%
jan 1, 1973
-23.402
-94.05
-133.12%
jan 1, 1974
32.802
+56.204
-240.17%
jan 1, 1975
23.279
-9.523
-29.03%
jan 1, 1976
-5.241
-28.52
-122.51%
jan 1, 1977
-21.724
-16.483
314.52%
jan 1, 1978
28.296
+50.019
-230.25%
jan 1, 1979
-13.291
-41.587
-146.97%
jan 1, 1980
3.521
+16.812
-126.5%
jan 1, 1981
14.26
+10.738
304.93%
jan 1, 1982
6.617
-7.642
-53.59%
jan 1, 1983
10.757
+4.14
62.56%
jan 1, 1984
-39.519
-50.276
-467.37%
jan 1, 1985
39.13
+78.649
-199.01%
jan 1, 1986
-11.758
-50.887
-130.05%
jan 1, 1987
-9.715
+2.043
-17.37%
jan 1, 1988
31.409
+41.124
-423.32%
jan 1, 1989
11.768
-19.641
-62.53%
jan 1, 1990
-16.233
-28.001
-237.94%
jan 1, 1991
-0.423
+15.811
-97.4%
jan 1, 1992
12.621
+13.044
-3.09K%
jan 1, 1993
-13.275
-25.896
-205.18%
jan 1, 1994
-2.592
+10.683
-80.48%
jan 1, 1995
-7.228
-4.637
178.92%
jan 1, 1996
7.41
+14.639
-202.51%
jan 1, 1997
13.96
+6.55
88.4%
jan 1, 1998
9.36
-4.6
-32.95%
jan 1, 1999
31.65
+22.29
238.14%
jan 1, 2000
-3.881
-35.531
-112.26%
jan 1, 2001
11.278
+15.158
-390.61%
jan 1, 2002
-3.71
-14.987
-132.9%
jan 1, 2003
-12.575
-8.865
238.96%
jan 1, 2004
9.36
+21.935
-174.43%
jan 1, 2005
26.693
+17.333
185.18%
jan 1, 2006
31.586
+4.892
18.33%
jan 1, 2007
25.207
-6.379
-20.19%
jan 1, 2008
-10.588
-35.795
-142.01%
jan 1, 2009
-18.222
-7.634
72.1%
jan 1, 2010
-49.095
-30.873
169.42%
jan 1, 2011
-8.555
+40.539
-82.57%
jan 1, 2012
11.648
+20.204
-236.15%
jan 1, 2013
5.278
-6.371
-54.69%
jan 1, 2014
-1.164
-6.442
-122.05%
jan 1, 2015
15.607
+16.771
-1.44K%
Ranking of countries by current statistics by years


Comments: