29
/
en
AIzaSyAYiBZKx7MnpbEhh9jyipgxe19OcubqV5w
April 1, 2024
222228
Peru
PER
true
2
1
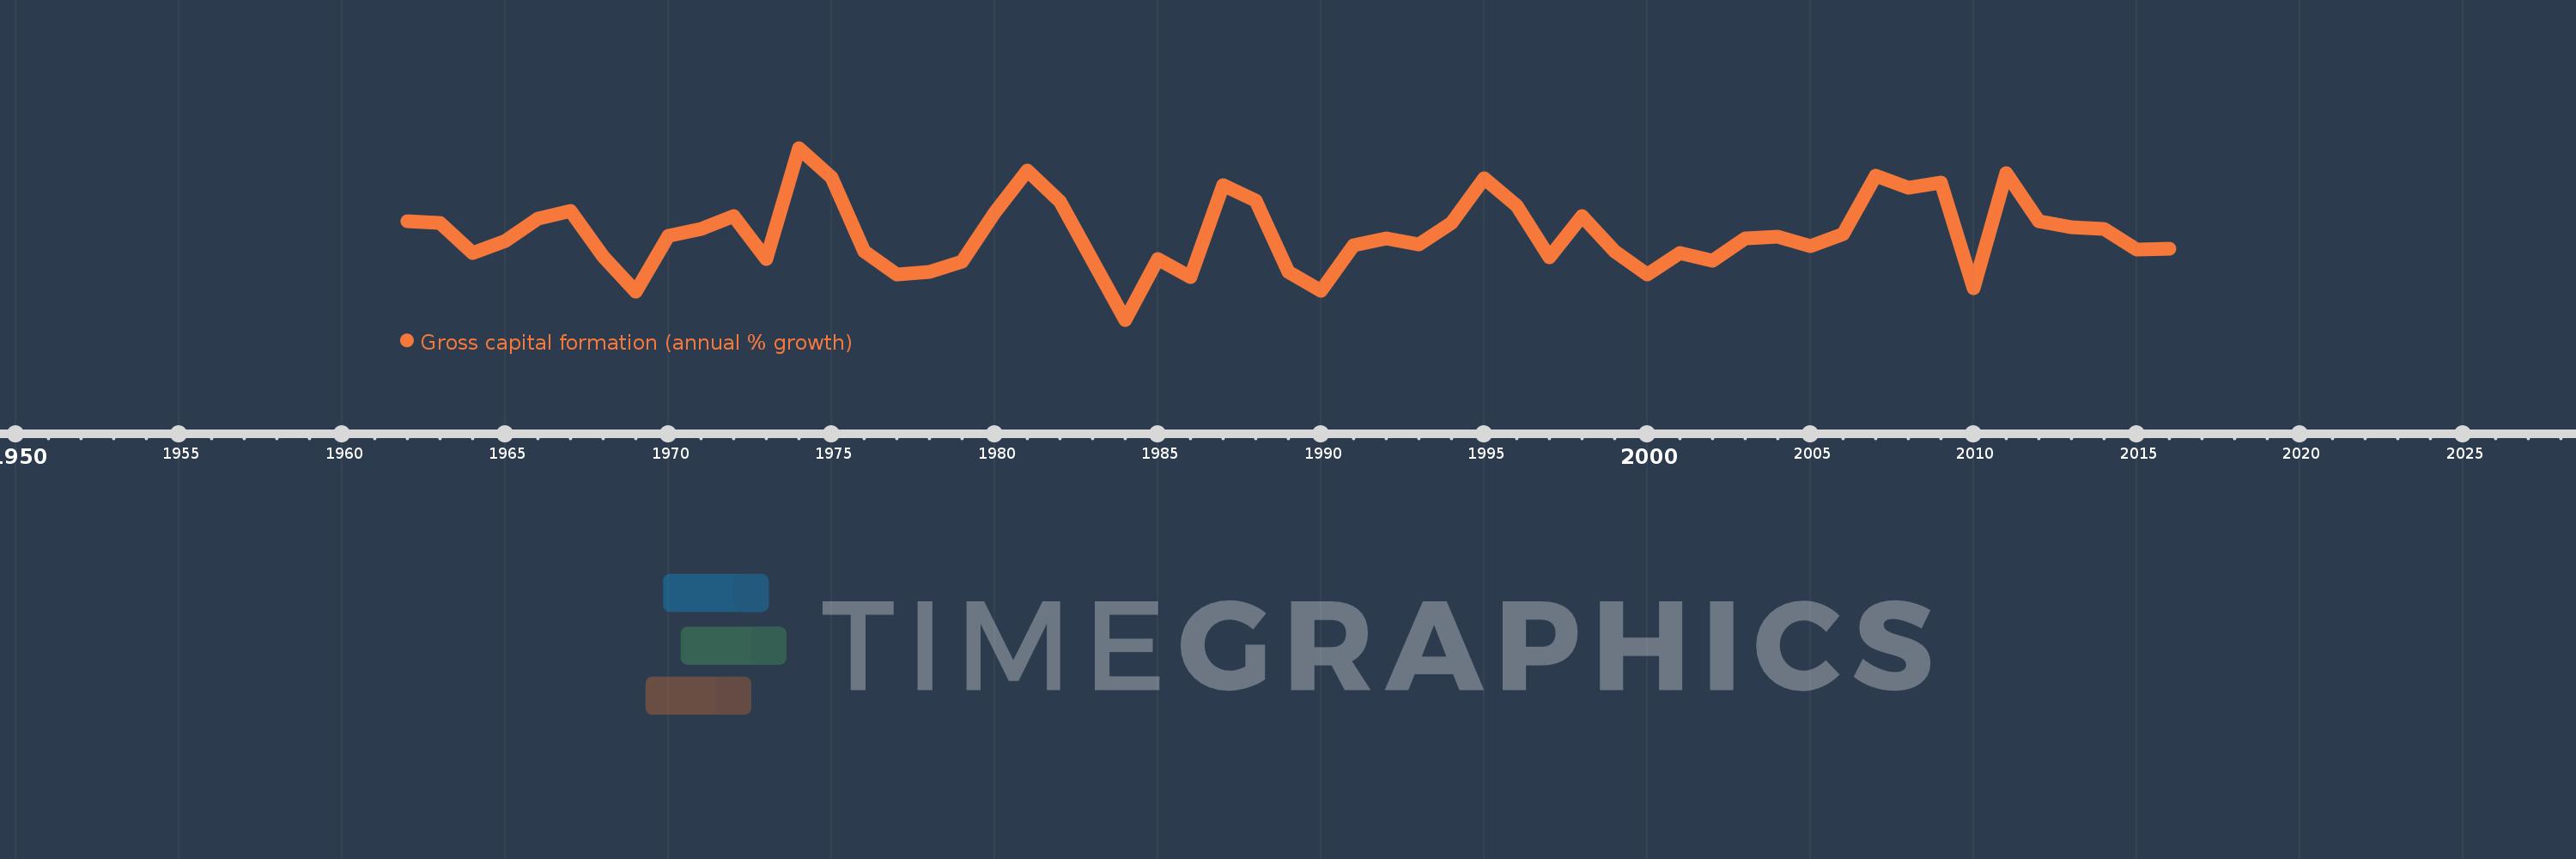
Gross capital formation (annual % growth)
2016,2015,2014,2013,2012,2011,2010,2009,2008,2007,2006,2005,2004,2003,2002,2001,2000,1999,1998,1997,1996,1995,1994,1993,1992,1991,1990,1989,1988,1987,1986,1985,1984,1983,1982,1981,1980,1979,1978,1977,1976,1975,1974,1973,1972,1971,1970,1969,1968,1967,1966,1965,1964,1963,1962
This statistics in other country:
AlbaniaAlgeriaAntigua and BarbudaArab WorldArgentinaArmeniaAustraliaAustriaAzerbaijanBahamas, TheBahrainBangladeshBarbadosBelarusBelgiumBelizeBeninBhutanBoliviaBosnia and HerzegovinaBotswanaBrazilBrunei DarussalamBulgariaBurkina FasoBurundiCabo VerdeCambodiaCameroonCanadaCaribbean small statesCentral Europe and the BalticsChadChileChinaColombiaComorosCongo, Dem. Rep.Congo, Rep.Costa RicaCote d'IvoireCroatiaCubaCyprusCzech RepublicDenmarkDjiboutiDominican RepublicEarly-demographic dividendEast Asia & PacificEast Asia & Pacific (excluding high income)East Asia & Pacific (IDA & IBRD countries)EcuadorEgypt, Arab Rep.El SalvadorEquatorial GuineaEritreaEstoniaEthiopiaEuro areaEurope & Central AsiaEurope & Central Asia (excluding high income)Europe & Central Asia (IDA & IBRD countries)European UnionFijiFinlandFranceGabonGambia, TheGeorgiaGermanyGhanaGreeceGuatemalaGuineaGuinea-BissauHaitiHeavily indebted poor countries (HIPC)High incomeHondurasHong Kong SAR, ChinaHungaryIBRD onlyIcelandIDA & IBRD totalIDA blendIDA onlyIDA totalIndiaIndonesiaIran, Islamic Rep.IrelandIsraelItalyJamaicaJapanJordanKazakhstanKenyaKorea, Rep.KosovoKuwaitKyrgyz RepublicLao PDRLate-demographic dividendLatin America & Caribbean Latin America & Caribbean (excluding high income)Latin America & the Caribbean (IDA & IBRD countries)LatviaLeast developed countries: UN classificationLebanonLiberiaLithuaniaLow & middle incomeLow incomeLower middle incomeLuxembourgMacao SAR, ChinaMacedonia, FYRMadagascarMalawiMalaysiaMaliMaltaMauritaniaMauritiusMexicoMiddle East & North AfricaMiddle East & North Africa (excluding high income)Middle East & North Africa (IDA & IBRD countries)Middle incomeMoldovaMongoliaMontenegroMoroccoMozambiqueNamibiaNepalNetherlandsNew ZealandNicaraguaNigerNigeriaNorth AmericaNorwayOECD membersOmanOther small statesPakistanPanamaPapua New GuineaParaguayPeruPhilippinesPolandPortugalPost-demographic dividendPre-demographic dividendPuerto RicoQatarRomaniaRussian FederationRwandaSaudi ArabiaSenegalSerbiaSeychellesSierra LeoneSingaporeSlovak RepublicSloveniaSmall statesSomaliaSouth AfricaSouth AsiaSouth Asia (IDA & IBRD)South SudanSpainSri LankaSub-Saharan Africa Sub-Saharan Africa (excluding high income)Sub-Saharan Africa (IDA & IBRD countries)SudanSurinameSwazilandSwedenSwitzerlandSyrian Arab RepublicTajikistanTanzaniaThailandTimor-LesteTogoTrinidad and TobagoTunisiaTurkeyTurkmenistanUgandaUkraineUnited Arab EmiratesUnited KingdomUnited StatesUpper middle incomeUruguayUzbekistanVanuatuVenezuela, RBVietnamWest Bank and GazaWorldZimbabwe Timeline:
This timeline shows a graph from 1962 to 2016 of Peru. No data until 1961. Number of actual observations by date: 55.
Source name:
World Development Indicators
Source organization:
World Bank national accounts data, and OECD National Accounts data files.
Categories, topics:
Economy & Growth
Last updated:
apr 23, 2017
Indicators value changes by year
Minimum:
-35.32
jan 1, 1984
Maximum:
47.902
jan 1, 1974
At the date of observation
Value
Absolute change
Change from previous value
jan 1, 1962
12.313
+12.313
0.0%
jan 1, 1963
11.486
-0.827
-6.72%
jan 1, 1964
-3.069
-14.555
-126.72%
jan 1, 1965
2.879
+5.947
-193.81%
jan 1, 1966
13.823
+10.945
380.19%
jan 1, 1967
17.222
+3.399
24.59%
jan 1, 1968
-4.589
-21.811
-126.64%
jan 1, 1969
-21.654
-17.066
371.91%
jan 1, 1970
5.411
+27.066
-124.99%
jan 1, 1971
8.849
+3.438
63.53%
jan 1, 1972
14.936
+6.087
68.78%
jan 1, 1973
-5.8
-20.736
-138.84%
jan 1, 1974
47.902
+53.703
-925.85%
jan 1, 1975
33.454
-14.449
-30.16%
jan 1, 1976
-1.979
-35.432
-105.91%
jan 1, 1977
-13.292
-11.314
571.78%
jan 1, 1978
-12.189
+1.103
-8.3%
jan 1, 1979
-7.22
+4.969
-40.77%
jan 1, 1980
16.726
+23.946
-331.67%
jan 1, 1981
36.761
+20.035
119.78%
jan 1, 1982
22.182
-14.579
-39.66%
jan 1, 1983
-6.785
-28.967
-130.59%
jan 1, 1984
-35.32
-28.536
420.59%
jan 1, 1985
-5.993
+29.327
-83.03%
jan 1, 1986
-14.623
-8.631
144.02%
jan 1, 1987
29.792
+44.415
-303.73%
jan 1, 1988
22.477
-7.315
-24.55%
jan 1, 1989
-11.967
-34.444
-153.24%
jan 1, 1990
-21.232
-9.265
77.42%
jan 1, 1991
0.597
+21.829
-102.81%
jan 1, 1992
4.206
+3.608
604.13%
jan 1, 1993
1.269
-2.937
-69.83%
jan 1, 1994
11.717
+10.448
823.32%
jan 1, 1995
33.022
+21.304
181.82%
jan 1, 1996
19.859
-13.162
-39.86%
jan 1, 1997
-4.908
-24.767
-124.71%
jan 1, 1998
14.915
+19.823
-403.9%
jan 1, 1999
-2.061
-16.976
-113.82%
jan 1, 2000
-13.456
-11.395
552.99%
jan 1, 2001
-2.912
+10.544
-78.36%
jan 1, 2002
-6.908
-3.996
137.25%
jan 1, 2003
3.956
+10.864
-157.27%
jan 1, 2004
5.073
+1.117
28.24%
jan 1, 2005
0.199
-4.874
-96.08%
jan 1, 2006
6.226
+6.028
3.03K%
jan 1, 2007
34.631
+28.404
456.18%
jan 1, 2008
28.634
-5.997
-17.32%
jan 1, 2009
31.096
+2.463
8.6%
jan 1, 2010
-20.204
-51.3
-164.97%
jan 1, 2011
35.816
+56.019
-277.27%
jan 1, 2012
12.209
-23.607
-65.91%
jan 1, 2013
9.494
-2.715
-22.24%
jan 1, 2014
8.504
-0.99
-10.43%
jan 1, 2015
-1.176
-9.68
-113.83%
jan 1, 2016
-0.78
+0.396
-33.64%
Ranking of countries by current statistics by years


Comments: