29
/
en
AIzaSyAYiBZKx7MnpbEhh9jyipgxe19OcubqV5w
April 1, 2024
272285
Uganda
UGA
true
2
1
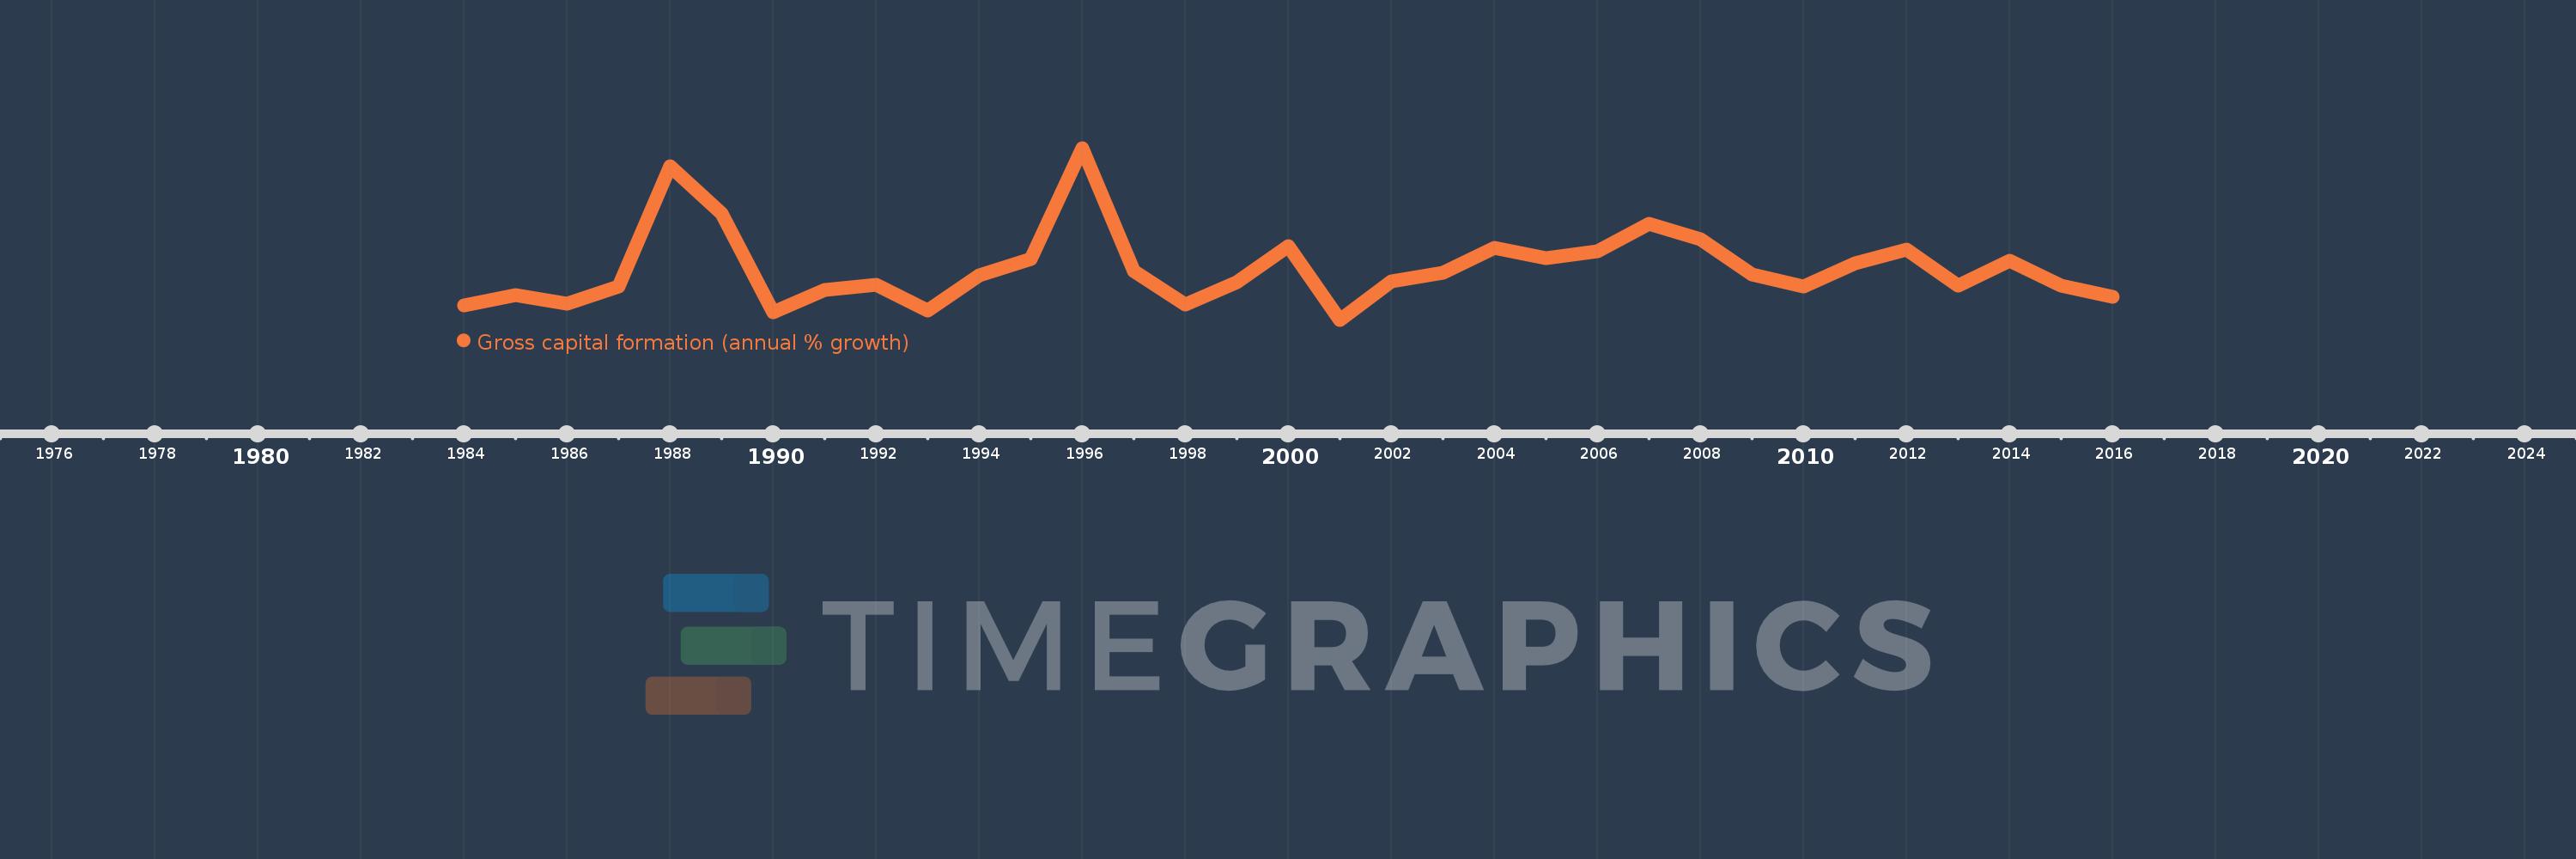
Gross capital formation (annual % growth)
2016,2015,2014,2013,2012,2011,2010,2009,2008,2007,2006,2005,2004,2003,2002,2001,2000,1999,1998,1997,1996,1995,1994,1993,1992,1991,1990,1989,1988,1987,1986,1985,1984
This statistics in other country:
AlbaniaAlgeriaAntigua and BarbudaArab WorldArgentinaArmeniaAustraliaAustriaAzerbaijanBahamas, TheBahrainBangladeshBarbadosBelarusBelgiumBelizeBeninBhutanBoliviaBosnia and HerzegovinaBotswanaBrazilBrunei DarussalamBulgariaBurkina FasoBurundiCabo VerdeCambodiaCameroonCanadaCaribbean small statesCentral Europe and the BalticsChadChileChinaColombiaComorosCongo, Dem. Rep.Congo, Rep.Costa RicaCote d'IvoireCroatiaCubaCyprusCzech RepublicDenmarkDjiboutiDominican RepublicEarly-demographic dividendEast Asia & PacificEast Asia & Pacific (excluding high income)East Asia & Pacific (IDA & IBRD countries)EcuadorEgypt, Arab Rep.El SalvadorEquatorial GuineaEritreaEstoniaEthiopiaEuro areaEurope & Central AsiaEurope & Central Asia (excluding high income)Europe & Central Asia (IDA & IBRD countries)European UnionFijiFinlandFranceGabonGambia, TheGeorgiaGermanyGhanaGreeceGuatemalaGuineaGuinea-BissauHaitiHeavily indebted poor countries (HIPC)High incomeHondurasHong Kong SAR, ChinaHungaryIBRD onlyIcelandIDA & IBRD totalIDA blendIDA onlyIDA totalIndiaIndonesiaIran, Islamic Rep.IrelandIsraelItalyJamaicaJapanJordanKazakhstanKenyaKorea, Rep.KosovoKuwaitKyrgyz RepublicLao PDRLate-demographic dividendLatin America & Caribbean Latin America & Caribbean (excluding high income)Latin America & the Caribbean (IDA & IBRD countries)LatviaLeast developed countries: UN classificationLebanonLiberiaLithuaniaLow & middle incomeLow incomeLower middle incomeLuxembourgMacao SAR, ChinaMacedonia, FYRMadagascarMalawiMalaysiaMaliMaltaMauritaniaMauritiusMexicoMiddle East & North AfricaMiddle East & North Africa (excluding high income)Middle East & North Africa (IDA & IBRD countries)Middle incomeMoldovaMongoliaMontenegroMoroccoMozambiqueNamibiaNepalNetherlandsNew ZealandNicaraguaNigerNigeriaNorth AmericaNorwayOECD membersOmanOther small statesPakistanPanamaPapua New GuineaParaguayPeruPhilippinesPolandPortugalPost-demographic dividendPre-demographic dividendPuerto RicoQatarRomaniaRussian FederationRwandaSaudi ArabiaSenegalSerbiaSeychellesSierra LeoneSingaporeSlovak RepublicSloveniaSmall statesSomaliaSouth AfricaSouth AsiaSouth Asia (IDA & IBRD)South SudanSpainSri LankaSub-Saharan Africa Sub-Saharan Africa (excluding high income)Sub-Saharan Africa (IDA & IBRD countries)SudanSurinameSwazilandSwedenSwitzerlandSyrian Arab RepublicTajikistanTanzaniaThailandTimor-LesteTogoTrinidad and TobagoTunisiaTurkeyTurkmenistanUgandaUkraineUnited Arab EmiratesUnited KingdomUnited StatesUpper middle incomeUruguayUzbekistanVanuatuVenezuela, RBVietnamWest Bank and GazaWorldZimbabwe Timeline:
This timeline shows a graph from 1984 to 2016 of Uganda. No data until 1983. Number of actual observations by date: 33.
Source name:
World Development Indicators
Source organization:
World Bank national accounts data, and OECD National Accounts data files.
Categories, topics:
Economy & Growth
Last updated:
apr 23, 2017
Indicators value changes by year
Minimum:
-6.987
jan 1, 2001
Maximum:
41.958
jan 1, 1996
At the date of observation
Value
Absolute change
Change from previous value
jan 1, 1984
-2.992
-2.992
0.0%
jan 1, 1985
-0.079
+2.913
-97.35%
jan 1, 1986
-2.506
-2.427
3.06K%
jan 1, 1987
2.475
+4.981
-198.75%
jan 1, 1988
36.865
+34.391
1.39K%
jan 1, 1989
23.258
-13.607
-36.91%
jan 1, 1990
-4.833
-28.091
-120.78%
jan 1, 1991
1.49
+6.323
-130.82%
jan 1, 1992
2.87
+1.38
92.67%
jan 1, 1993
-4.482
-7.352
-256.18%
jan 1, 1994
5.547
+10.029
-223.74%
jan 1, 1995
10.306
+4.76
85.82%
jan 1, 1996
41.958
+31.651
307.1%
jan 1, 1997
6.93
-35.028
-83.48%
jan 1, 1998
-2.657
-9.587
-138.34%
jan 1, 1999
3.714
+6.371
-239.76%
jan 1, 2000
13.959
+10.245
275.88%
jan 1, 2001
-6.987
-20.946
-150.06%
jan 1, 2002
3.926
+10.914
-156.19%
jan 1, 2003
6.519
+2.593
66.05%
jan 1, 2004
13.517
+6.998
107.33%
jan 1, 2005
10.614
-2.903
-21.47%
jan 1, 2006
12.457
+1.843
17.36%
jan 1, 2007
20.348
+7.89
63.34%
jan 1, 2008
15.972
-4.376
-21.51%
jan 1, 2009
6.013
-9.958
-62.35%
jan 1, 2010
2.458
-3.555
-59.12%
jan 1, 2011
9.033
+6.575
267.43%
jan 1, 2012
13.012
+3.979
44.05%
jan 1, 2013
2.746
-10.267
-78.9%
jan 1, 2014
9.832
+7.086
258.11%
jan 1, 2015
2.65
-7.182
-73.04%
jan 1, 2016
-0.5
-3.15
-118.87%
Ranking of countries by current statistics by years


Comments: