29
/
en
AIzaSyAYiBZKx7MnpbEhh9jyipgxe19OcubqV5w
April 1, 2024
235815
Senegal
SEN
true
2
1
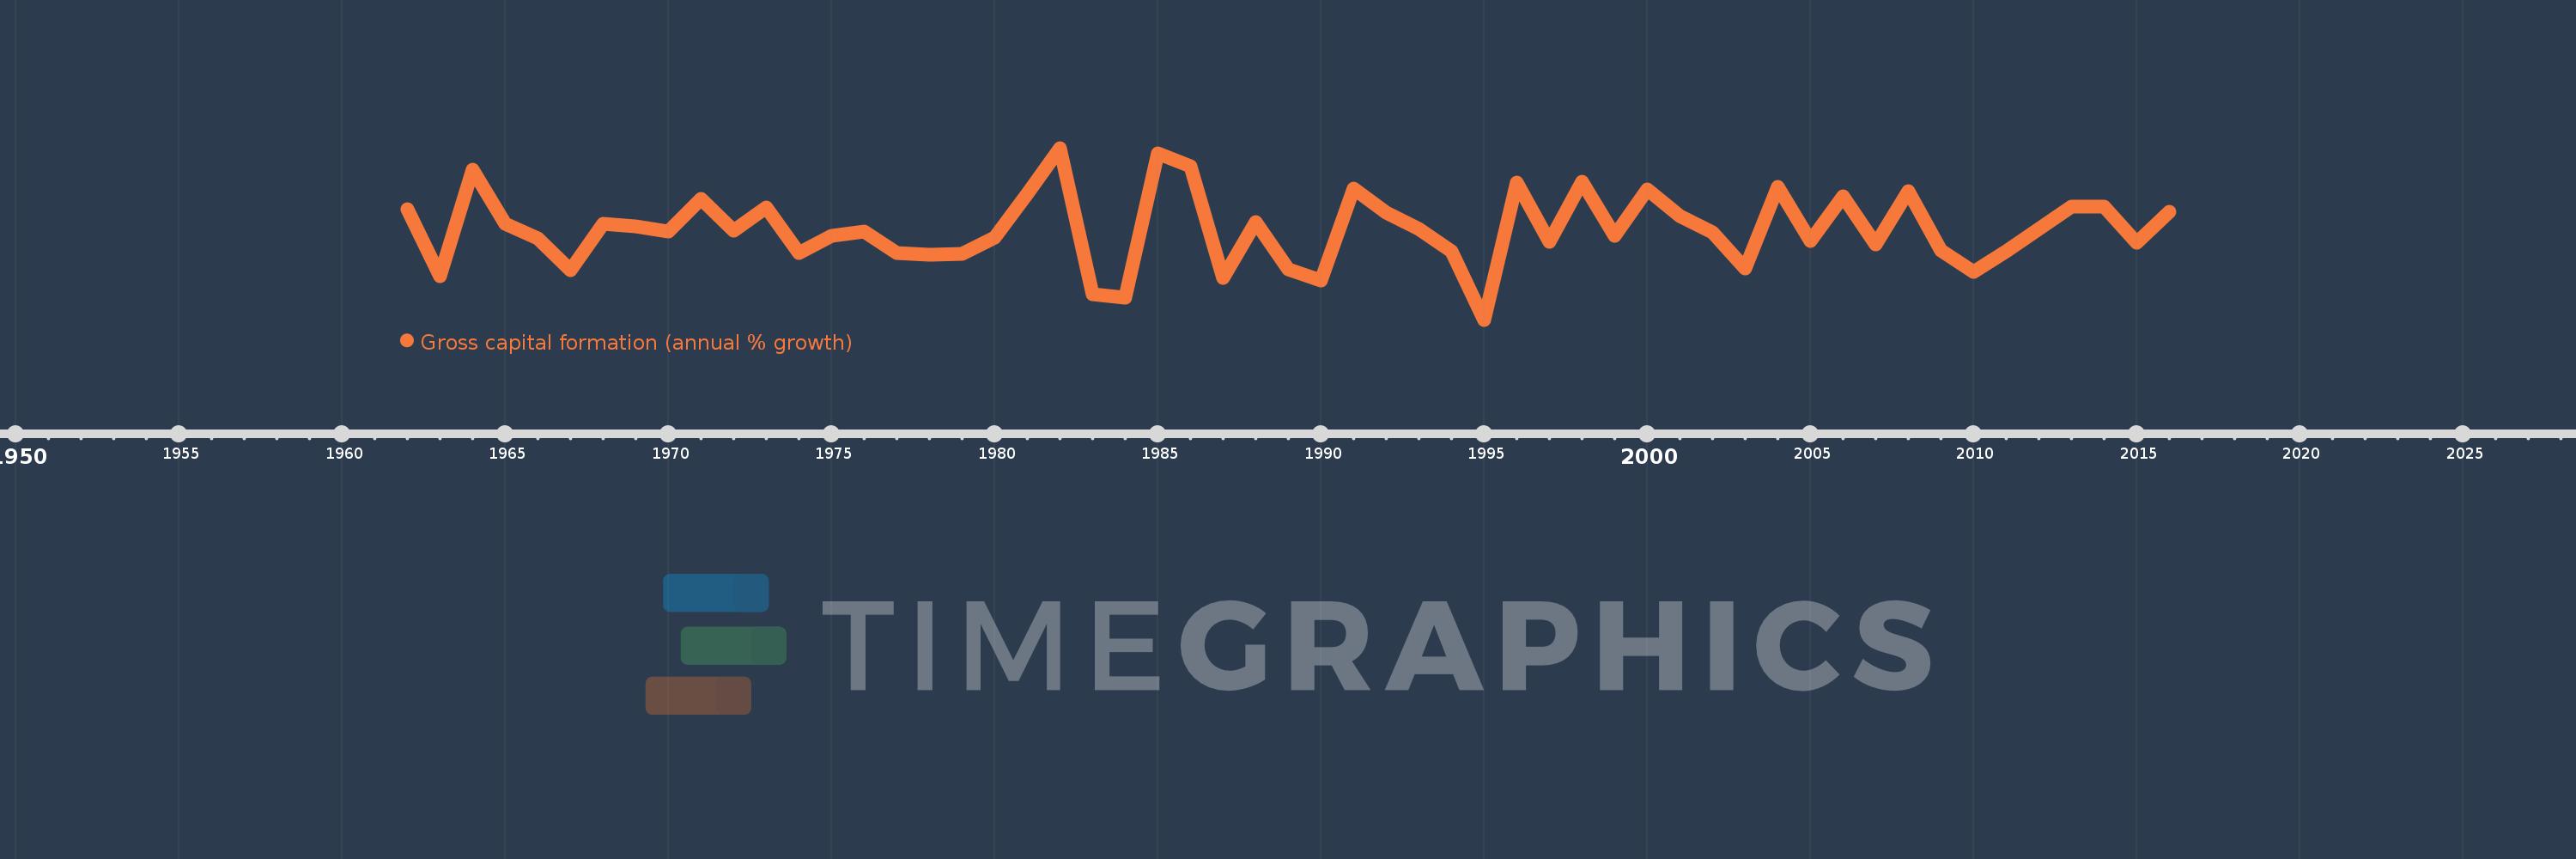
Gross capital formation (annual % growth)
2016,2015,2014,2013,2012,2011,2010,2009,2008,2007,2006,2005,2004,2003,2002,2001,2000,1999,1998,1997,1996,1995,1994,1993,1992,1991,1990,1989,1988,1987,1986,1985,1984,1983,1982,1981,1980,1979,1978,1977,1976,1975,1974,1973,1972,1971,1970,1969,1968,1967,1966,1965,1964,1963,1962
This statistics in other country:
AlbaniaAlgeriaAntigua and BarbudaArab WorldArgentinaArmeniaAustraliaAustriaAzerbaijanBahamas, TheBahrainBangladeshBarbadosBelarusBelgiumBelizeBeninBhutanBoliviaBosnia and HerzegovinaBotswanaBrazilBrunei DarussalamBulgariaBurkina FasoBurundiCabo VerdeCambodiaCameroonCanadaCaribbean small statesCentral Europe and the BalticsChadChileChinaColombiaComorosCongo, Dem. Rep.Congo, Rep.Costa RicaCote d'IvoireCroatiaCubaCyprusCzech RepublicDenmarkDjiboutiDominican RepublicEarly-demographic dividendEast Asia & PacificEast Asia & Pacific (excluding high income)East Asia & Pacific (IDA & IBRD countries)EcuadorEgypt, Arab Rep.El SalvadorEquatorial GuineaEritreaEstoniaEthiopiaEuro areaEurope & Central AsiaEurope & Central Asia (excluding high income)Europe & Central Asia (IDA & IBRD countries)European UnionFijiFinlandFranceGabonGambia, TheGeorgiaGermanyGhanaGreeceGuatemalaGuineaGuinea-BissauHaitiHeavily indebted poor countries (HIPC)High incomeHondurasHong Kong SAR, ChinaHungaryIBRD onlyIcelandIDA & IBRD totalIDA blendIDA onlyIDA totalIndiaIndonesiaIran, Islamic Rep.IrelandIsraelItalyJamaicaJapanJordanKazakhstanKenyaKorea, Rep.KosovoKuwaitKyrgyz RepublicLao PDRLate-demographic dividendLatin America & Caribbean Latin America & Caribbean (excluding high income)Latin America & the Caribbean (IDA & IBRD countries)LatviaLeast developed countries: UN classificationLebanonLiberiaLithuaniaLow & middle incomeLow incomeLower middle incomeLuxembourgMacao SAR, ChinaMacedonia, FYRMadagascarMalawiMalaysiaMaliMaltaMauritaniaMauritiusMexicoMiddle East & North AfricaMiddle East & North Africa (excluding high income)Middle East & North Africa (IDA & IBRD countries)Middle incomeMoldovaMongoliaMontenegroMoroccoMozambiqueNamibiaNepalNetherlandsNew ZealandNicaraguaNigerNigeriaNorth AmericaNorwayOECD membersOmanOther small statesPakistanPanamaPapua New GuineaParaguayPeruPhilippinesPolandPortugalPost-demographic dividendPre-demographic dividendPuerto RicoQatarRomaniaRussian FederationRwandaSaudi ArabiaSenegalSerbiaSeychellesSierra LeoneSingaporeSlovak RepublicSloveniaSmall statesSomaliaSouth AfricaSouth AsiaSouth Asia (IDA & IBRD)South SudanSpainSri LankaSub-Saharan Africa Sub-Saharan Africa (excluding high income)Sub-Saharan Africa (IDA & IBRD countries)SudanSurinameSwazilandSwedenSwitzerlandSyrian Arab RepublicTajikistanTanzaniaThailandTimor-LesteTogoTrinidad and TobagoTunisiaTurkeyTurkmenistanUgandaUkraineUnited Arab EmiratesUnited KingdomUnited StatesUpper middle incomeUruguayUzbekistanVanuatuVenezuela, RBVietnamWest Bank and GazaWorldZimbabwe Timeline:
This timeline shows a graph from 1962 to 2016 of Senegal. No data until 1961. Number of actual observations by date: 55.
Source name:
World Development Indicators
Source organization:
World Bank national accounts data, and OECD National Accounts data files.
Categories, topics:
Economy & Growth
Last updated:
apr 23, 2017
Indicators value changes by year
Minimum:
-40.885
jan 1, 1995
Maximum:
47.988
jan 1, 1982
At the date of observation
Value
Absolute change
Change from previous value
jan 1, 1962
16.162
+16.162
0.0%
jan 1, 1963
-18.261
-34.422
-212.99%
jan 1, 1964
36.702
+54.963
-300.99%
jan 1, 1965
8.56
-28.142
-76.68%
jan 1, 1966
1.075
-7.485
-87.44%
jan 1, 1967
-15.039
-16.114
-1.5K%
jan 1, 1968
8.682
+23.721
-157.73%
jan 1, 1969
7.208
-1.474
-16.98%
jan 1, 1970
4.81
-2.398
-33.26%
jan 1, 1971
21.472
+16.662
346.4%
jan 1, 1972
5.283
-16.189
-75.4%
jan 1, 1973
17.169
+11.886
224.97%
jan 1, 1974
-6.237
-23.406
-136.33%
jan 1, 1975
2.602
+8.839
-141.72%
jan 1, 1976
4.716
+2.114
81.23%
jan 1, 1977
-6.223
-10.938
-231.95%
jan 1, 1978
-7.331
-1.109
17.82%
jan 1, 1979
-6.644
+0.688
-9.38%
jan 1, 1980
1.647
+8.29
-124.79%
jan 1, 1981
24.128
+22.481
1.37K%
jan 1, 1982
47.988
+23.86
98.89%
jan 1, 1983
-27.73
-75.717
-157.78%
jan 1, 1984
-29.247
-1.517
5.47%
jan 1, 1985
45.009
+74.256
-253.89%
jan 1, 1986
38.738
-6.271
-13.93%
jan 1, 1987
-19.303
-58.041
-149.83%
jan 1, 1988
9.623
+28.927
-149.85%
jan 1, 1989
-14.983
-24.607
-255.69%
jan 1, 1990
-20.548
-5.565
37.14%
jan 1, 1991
27.053
+47.602
-231.66%
jan 1, 1992
14.379
-12.675
-46.85%
jan 1, 1993
6.066
-8.313
-57.81%
jan 1, 1994
-5.601
-11.667
-192.34%
jan 1, 1995
-40.885
-35.284
629.97%
jan 1, 1996
29.969
+70.854
-173.3%
jan 1, 1997
-0.43
-30.399
-101.43%
jan 1, 1998
30.649
+31.078
-7.23K%
jan 1, 1999
2.331
-28.318
-92.39%
jan 1, 2000
26.443
+24.112
1.03K%
jan 1, 2001
12.97
-13.473
-50.95%
jan 1, 2002
4.268
-8.702
-67.09%
jan 1, 2003
-14.486
-18.755
-439.41%
jan 1, 2004
27.958
+42.444
-292.99%
jan 1, 2005
-0.22
-28.178
-100.79%
jan 1, 2006
23.154
+23.374
-10.61K%
jan 1, 2007
-2.107
-25.261
-109.1%
jan 1, 2008
25.451
+27.558
-1.31K%
jan 1, 2009
-5.126
-30.577
-120.14%
jan 1, 2010
-16.296
-11.17
217.89%
jan 1, 2011
-5.337
+10.958
-67.25%
jan 1, 2012
5.966
+11.303
-211.78%
jan 1, 2013
17.478
+11.512
192.97%
jan 1, 2014
17.479
+0.0
0.0%
jan 1, 2015
-1.207
-18.686
-106.9%
jan 1, 2016
14.881
+16.088
-1.33K%
Ranking of countries by current statistics by years


Comments: