29
/
en
AIzaSyAYiBZKx7MnpbEhh9jyipgxe19OcubqV5w
April 1, 2024
65448
Albania
ALB
true
2
1
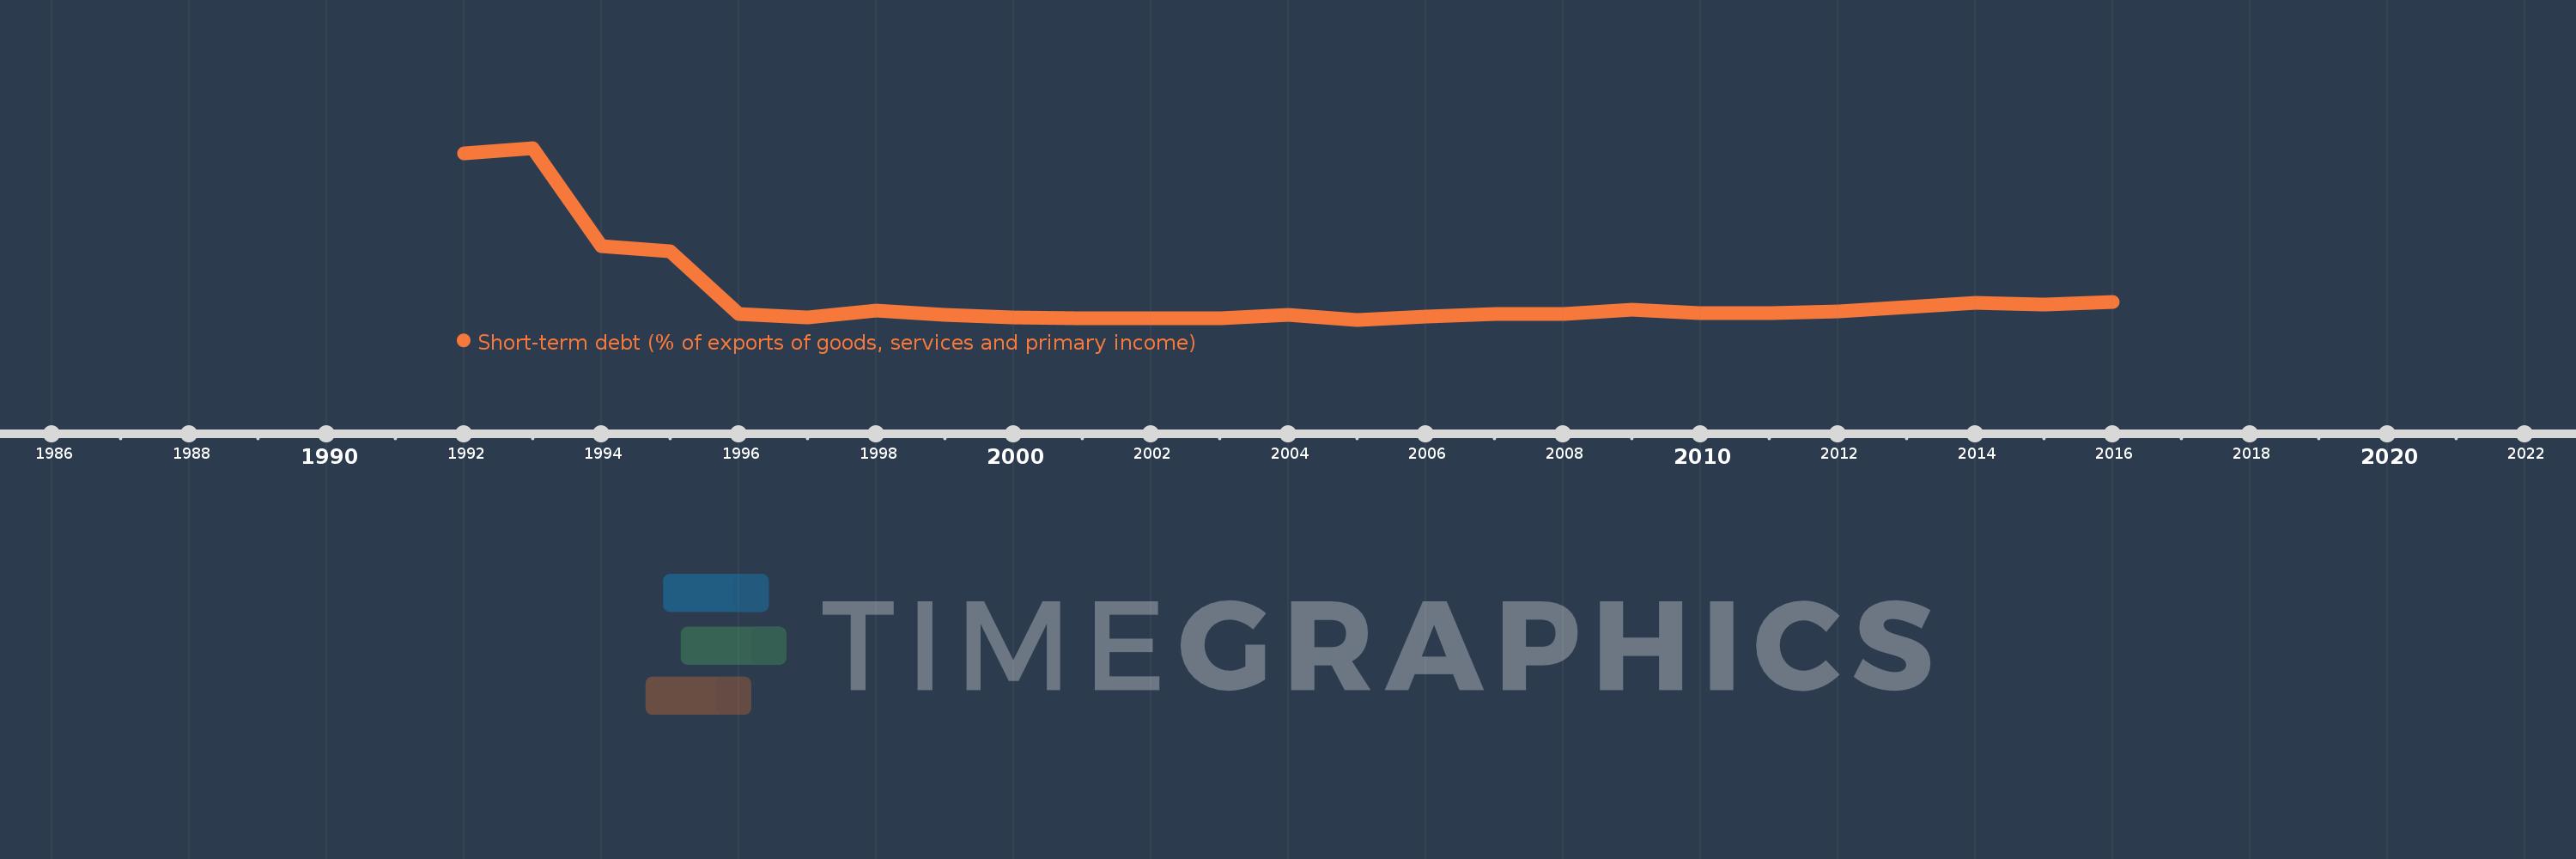
Short-term debt (% of exports of goods, services and primary income)
2016,2015,2014,2013,2012,2011,2010,2009,2008,2007,2006,2005,2004,2003,2002,2001,2000,1999,1998,1997,1996,1995,1994,1993,1992
This statistics in other country:
Timeline:
This timeline shows a graph from 1992 to 2016 of Albania. No data until 1991. Number of actual observations by date: 25.
Source name:
World Development Indicators
Source organization:
World Bank, International Debt Statistics.
Categories, topics:
Economy & Growth, External Debt
Last updated:
apr 23, 2017
Indicators value changes by year
Maximum:
530.083
jan 1, 1993
At the date of observation
Value
Absolute change
Change from previous value
jan 1, 1992
512.392
+512.392
0.0%
jan 1, 1993
530.083
+17.691
3.45%
jan 1, 1994
227.227
-302.856
-57.13%
jan 1, 1995
211.014
-16.213
-7.14%
jan 1, 1996
16.592
-194.422
-92.14%
jan 1, 1997
6.918
-9.673
-58.3%
jan 1, 1998
29.719
+22.801
329.58%
jan 1, 1999
15.639
-14.081
-47.38%
jan 1, 2000
6.113
-9.525
-60.91%
jan 1, 2001
5.469
-0.644
-10.54%
jan 1, 2002
3.731
-1.738
-31.79%
jan 1, 2003
3.562
-0.169
-4.53%
jan 1, 2004
14.347
+10.785
302.8%
jan 1, 2005
0.084
-14.263
-99.41%
jan 1, 2006
9.188
+9.103
10.78K%
jan 1, 2007
17.554
+8.366
91.05%
jan 1, 2008
17.938
+0.385
2.19%
jan 1, 2009
30.648
+12.71
70.85%
jan 1, 2010
19.79
-10.858
-35.43%
jan 1, 2011
20.064
+0.274
1.39%
jan 1, 2012
26.77
+6.707
33.43%
jan 1, 2013
38.685
+11.914
44.5%
jan 1, 2014
51.903
+13.219
34.17%
jan 1, 2015
48.077
-3.826
-7.37%
jan 1, 2016
53.646
+5.57
11.58%
Ranking of countries by current statistics by years


Comments: