29
/
en
AIzaSyAYiBZKx7MnpbEhh9jyipgxe19OcubqV5w
April 1, 2024
266348
Tonga
TON
true
2
1
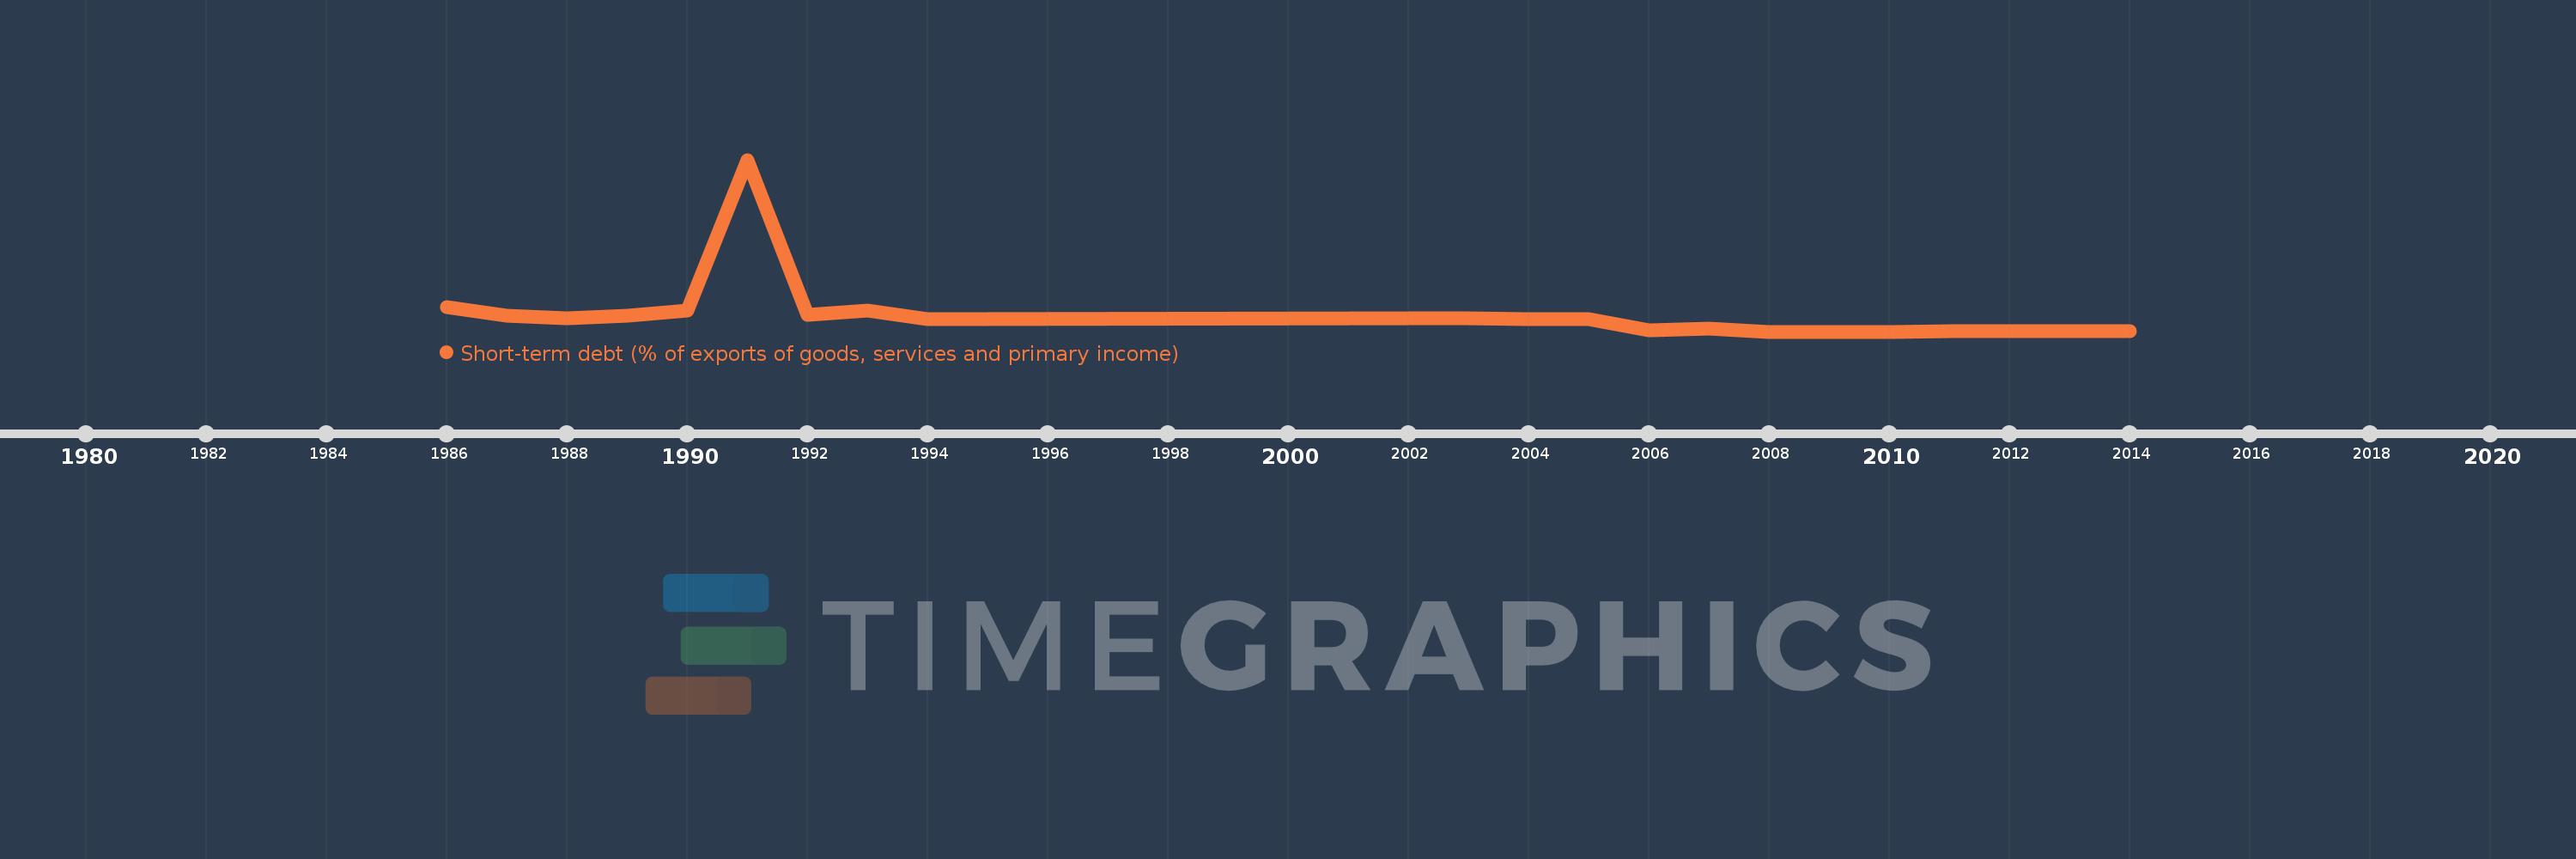
Short-term debt (% of exports of goods, services and primary income)
2014,2013,2012,2011,2010,2009,2008,2007,2006,2005,2004,2003,2002,1994,1993,1992,1991,1990,1989,1988,1987,1986
This statistics in other country:
Timeline:
This timeline shows a graph from 1986 to 2014 of Tonga. No data until 1985. Number of actual observations by date: 22.
Source name:
World Development Indicators
Source organization:
World Bank, International Debt Statistics.
Categories, topics:
Economy & Growth, External Debt
Last updated:
apr 23, 2017
Indicators value changes by year
Maximum:
21.235
jan 1, 1991
At the date of observation
Value
Absolute change
Change from previous value
jan 1, 1986
2.98
+2.98
0.0%
jan 1, 1987
1.913
-1.068
-35.82%
jan 1, 1988
1.685
-0.227
-11.89%
jan 1, 1989
1.916
+0.231
13.68%
jan 1, 1990
2.625
+0.709
36.99%
jan 1, 1991
21.235
+18.61
709.08%
jan 1, 1992
2.034
-19.201
-90.42%
jan 1, 1993
2.562
+0.529
25.99%
jan 1, 1994
1.516
-1.046
-40.83%
jan 1, 2002
1.648
+0.132
8.69%
jan 1, 2003
1.624
-0.025
-1.49%
jan 1, 2004
1.487
-0.136
-8.38%
jan 1, 2005
1.571
+0.084
5.61%
jan 1, 2006
0.2
-1.371
-87.26%
jan 1, 2007
0.35
+0.15
75.0%
jan 1, 2008
0.0
-0.35
-100.0%
jan 1, 2011
0.016
+0.016
%
jan 1, 2012
0.026
+0.01
62.53%
jan 1, 2013
0.033
+0.007
25.33%
jan 1, 2014
0.003
-0.03
-91.84%
Ranking of countries by current statistics by years


Comments: