29
/
en
AIzaSyAYiBZKx7MnpbEhh9jyipgxe19OcubqV5w
April 1, 2024
155346
India
IND
true
2
1
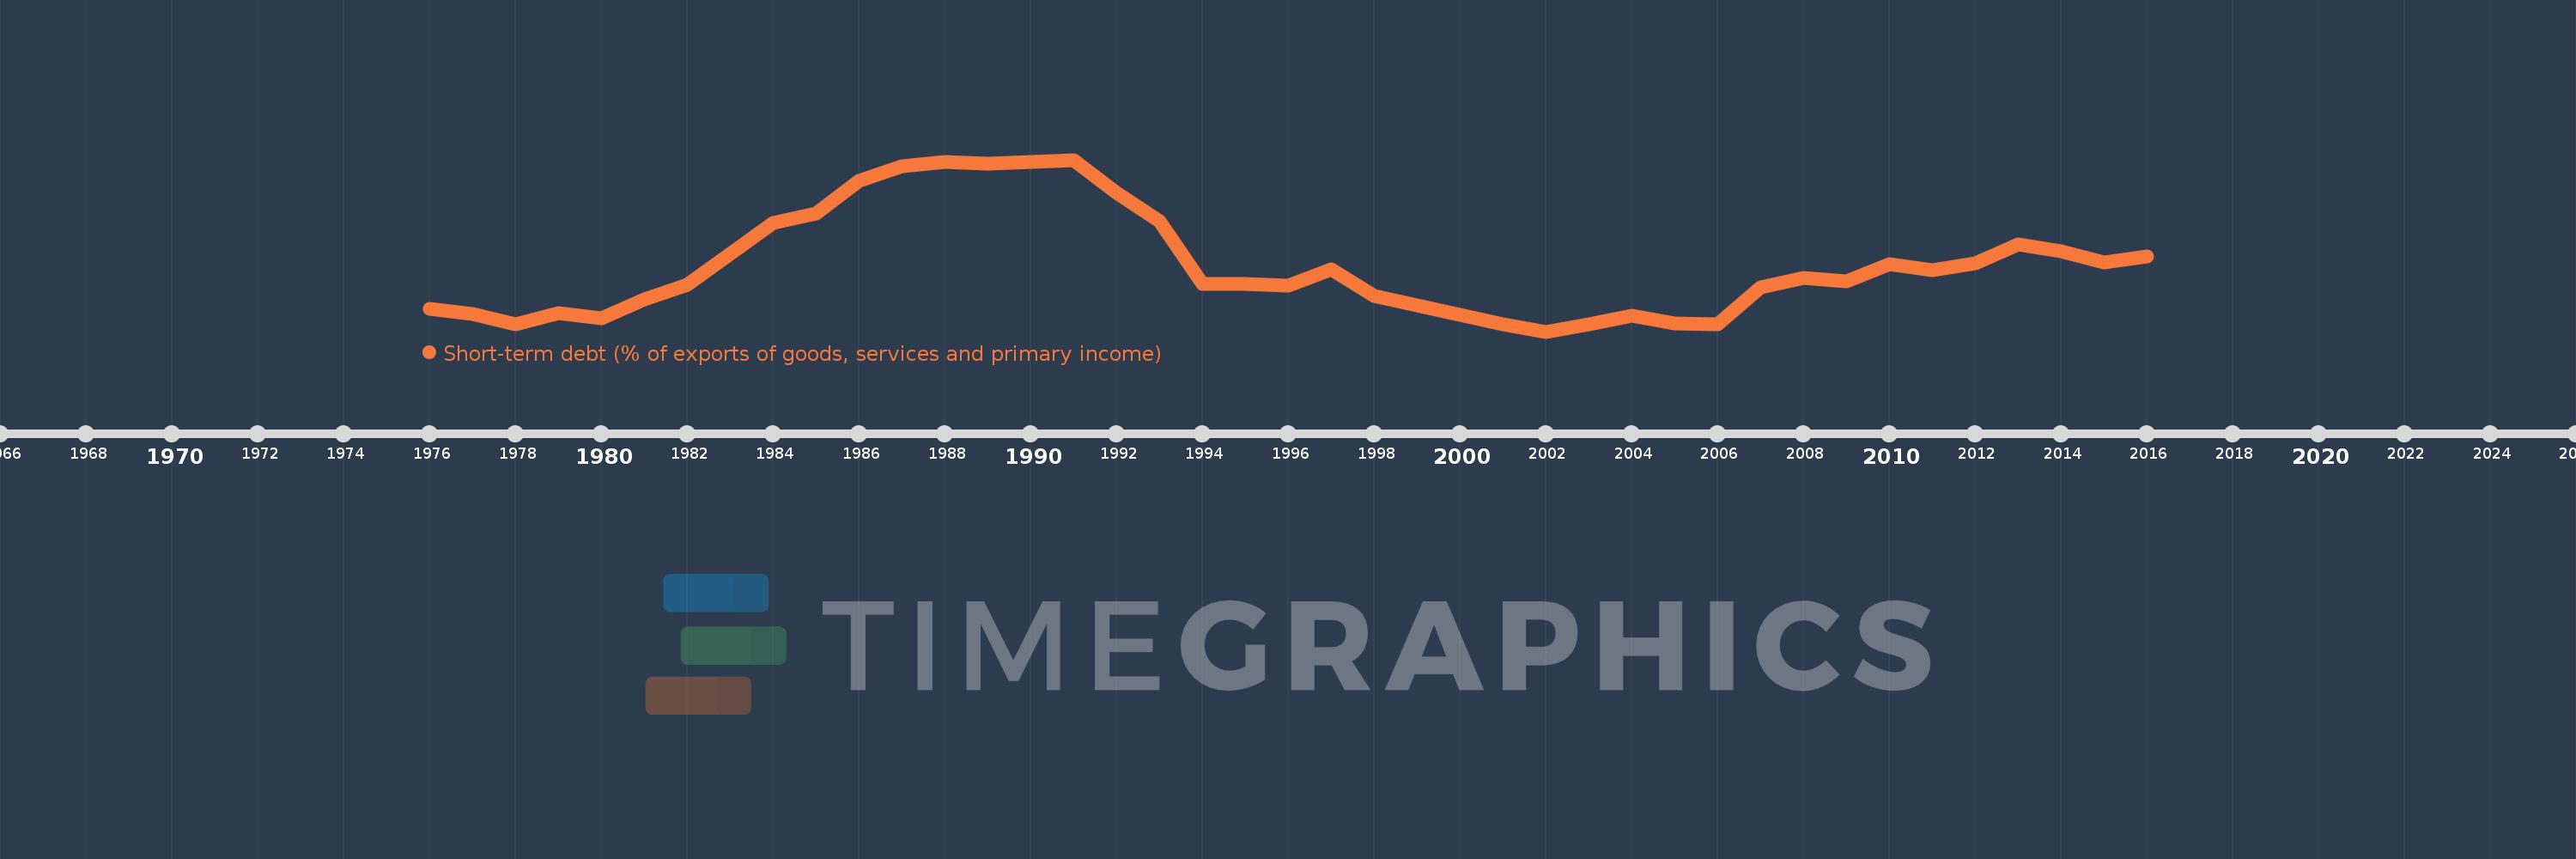
Short-term debt (% of exports of goods, services and primary income)
2016,2015,2014,2013,2012,2011,2010,2009,2008,2007,2006,2005,2004,2003,2002,2001,2000,1999,1998,1997,1996,1995,1994,1993,1992,1991,1990,1989,1988,1987,1986,1985,1984,1983,1982,1981,1980,1979,1978,1977,1976
This statistics in other country:
Timeline:
This timeline shows a graph from 1976 to 2016 of India. No data until 1975. Number of actual observations by date: 41.
Source name:
World Development Indicators
Source organization:
World Bank, International Debt Statistics.
Categories, topics:
Economy & Growth, External Debt
Last updated:
apr 23, 2017
Indicators value changes by year
Maximum:
36.595
jan 1, 1991
At the date of observation
Value
Absolute change
Change from previous value
jan 1, 1976
8.391
+8.391
0.0%
jan 1, 1977
7.491
-0.9
-10.73%
jan 1, 1978
5.51
-1.981
-26.45%
jan 1, 1979
7.646
+2.136
38.77%
jan 1, 1980
6.693
-0.952
-12.46%
jan 1, 1981
10.306
+3.613
53.98%
jan 1, 1982
13.083
+2.777
26.95%
jan 1, 1983
18.775
+5.692
43.5%
jan 1, 1984
24.653
+5.878
31.31%
jan 1, 1985
26.397
+1.743
7.07%
jan 1, 1986
32.577
+6.18
23.41%
jan 1, 1987
35.344
+2.767
8.49%
jan 1, 1988
36.14
+0.796
2.25%
jan 1, 1989
35.864
-0.277
-0.77%
jan 1, 1990
36.184
+0.321
0.89%
jan 1, 1991
36.595
+0.411
1.13%
jan 1, 1992
30.406
-6.189
-16.91%
jan 1, 1993
25.029
-5.377
-17.68%
jan 1, 1994
13.186
-11.843
-47.32%
jan 1, 1995
13.168
-0.018
-0.14%
jan 1, 1996
12.783
-0.385
-2.93%
jan 1, 1997
15.868
+3.086
24.14%
jan 1, 1998
10.899
-4.969
-31.31%
jan 1, 1999
9.1
-1.8
-16.51%
jan 1, 2000
7.378
-1.722
-18.92%
jan 1, 2001
5.543
-1.835
-24.87%
jan 1, 2002
4.176
-1.367
-24.66%
jan 1, 2003
5.546
+1.369
32.78%
jan 1, 2004
7.166
+1.621
29.23%
jan 1, 2005
5.686
-1.48
-20.65%
jan 1, 2006
5.502
-0.184
-3.24%
jan 1, 2007
12.454
+6.952
126.35%
jan 1, 2008
14.281
+1.827
14.67%
jan 1, 2009
13.664
-0.617
-4.32%
jan 1, 2010
16.972
+3.309
24.22%
jan 1, 2011
15.768
-1.205
-7.1%
jan 1, 2012
17.097
+1.329
8.43%
jan 1, 2013
20.573
+3.476
20.33%
jan 1, 2014
19.334
-1.239
-6.02%
jan 1, 2015
17.176
-2.158
-11.16%
jan 1, 2016
18.405
+1.229
7.15%
Ranking of countries by current statistics by years


Comments: