29
/
en
AIzaSyAYiBZKx7MnpbEhh9jyipgxe19OcubqV5w
April 1, 2024
220239
Papua New Guinea
PNG
true
2
1
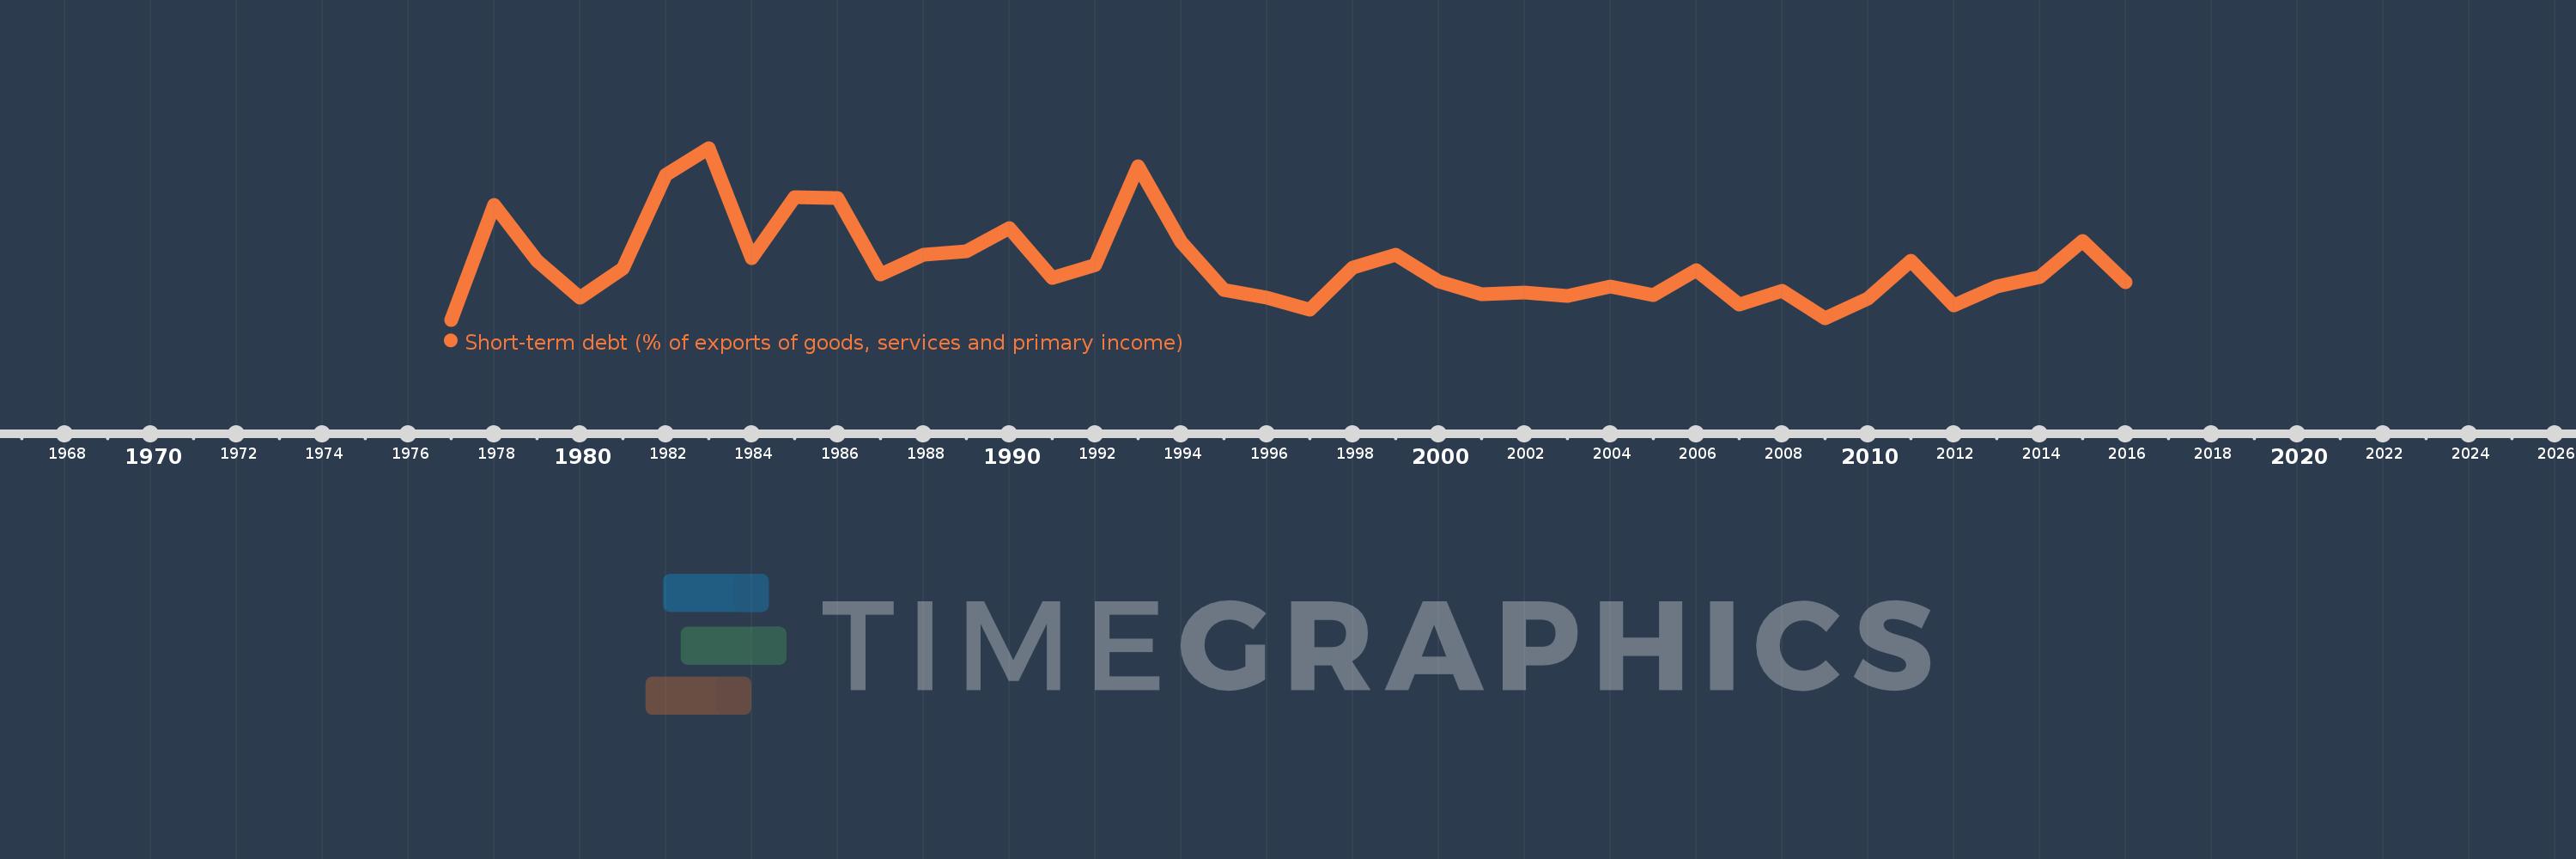
Short-term debt (% of exports of goods, services and primary income)
2016,2015,2014,2013,2012,2011,2010,2009,2008,2007,2006,2005,2004,2003,2002,2001,2000,1999,1998,1997,1996,1995,1994,1993,1992,1991,1990,1989,1988,1987,1986,1985,1984,1983,1982,1981,1980,1979,1978,1977
This statistics in other country:
Timeline:
This timeline shows a graph from 1977 to 2016 of Papua New Guinea. No data until 1976. Number of actual observations by date: 40.
Source name:
World Development Indicators
Source organization:
World Bank, International Debt Statistics.
Categories, topics:
Economy & Growth, External Debt
Last updated:
apr 23, 2017
Indicators value changes by year
Maximum:
19.701
jan 1, 1983
At the date of observation
Value
Absolute change
Change from previous value
jan 1, 1978
13.174
+13.174
%
jan 1, 1979
6.731
-6.443
-48.91%
jan 1, 1980
2.542
-4.189
-62.24%
jan 1, 1981
5.879
+3.337
131.29%
jan 1, 1982
16.662
+10.783
183.41%
jan 1, 1983
19.701
+3.038
18.23%
jan 1, 1984
7.021
-12.679
-64.36%
jan 1, 1985
14.074
+7.053
100.45%
jan 1, 1986
13.96
-0.114
-0.81%
jan 1, 1987
5.19
-8.771
-62.83%
jan 1, 1988
7.505
+2.315
44.62%
jan 1, 1989
7.861
+0.356
4.74%
jan 1, 1990
10.467
+2.606
33.15%
jan 1, 1991
4.814
-5.652
-54.0%
jan 1, 1992
6.322
+1.508
31.31%
jan 1, 1993
17.643
+11.321
179.08%
jan 1, 1994
8.97
-8.673
-49.16%
jan 1, 1995
3.403
-5.567
-62.06%
jan 1, 1996
2.575
-0.828
-24.34%
jan 1, 1997
1.129
-1.446
-56.16%
jan 1, 1998
5.941
+4.812
426.27%
jan 1, 1999
7.42
+1.479
24.89%
jan 1, 2000
4.443
-2.977
-40.12%
jan 1, 2001
2.955
-1.488
-33.49%
jan 1, 2002
3.163
+0.208
7.05%
jan 1, 2003
2.732
-0.432
-13.65%
jan 1, 2004
3.833
+1.101
40.32%
jan 1, 2005
2.808
-1.025
-26.74%
jan 1, 2006
5.673
+2.865
102.04%
jan 1, 2007
1.718
-3.955
-69.71%
jan 1, 2008
3.343
+1.625
94.54%
jan 1, 2009
0.16
-3.183
-95.22%
jan 1, 2010
2.422
+2.263
1.42K%
jan 1, 2011
6.791
+4.368
180.33%
jan 1, 2012
1.667
-5.124
-75.45%
jan 1, 2013
3.809
+2.142
128.53%
jan 1, 2014
4.9
+1.091
28.65%
jan 1, 2015
8.996
+4.096
83.58%
jan 1, 2016
4.295
-4.701
-52.26%
Ranking of countries by current statistics by years


Comments: