29
/
en
AIzaSyAYiBZKx7MnpbEhh9jyipgxe19OcubqV5w
April 1, 2024
122876
Dominican Republic
DOM
true
2
1
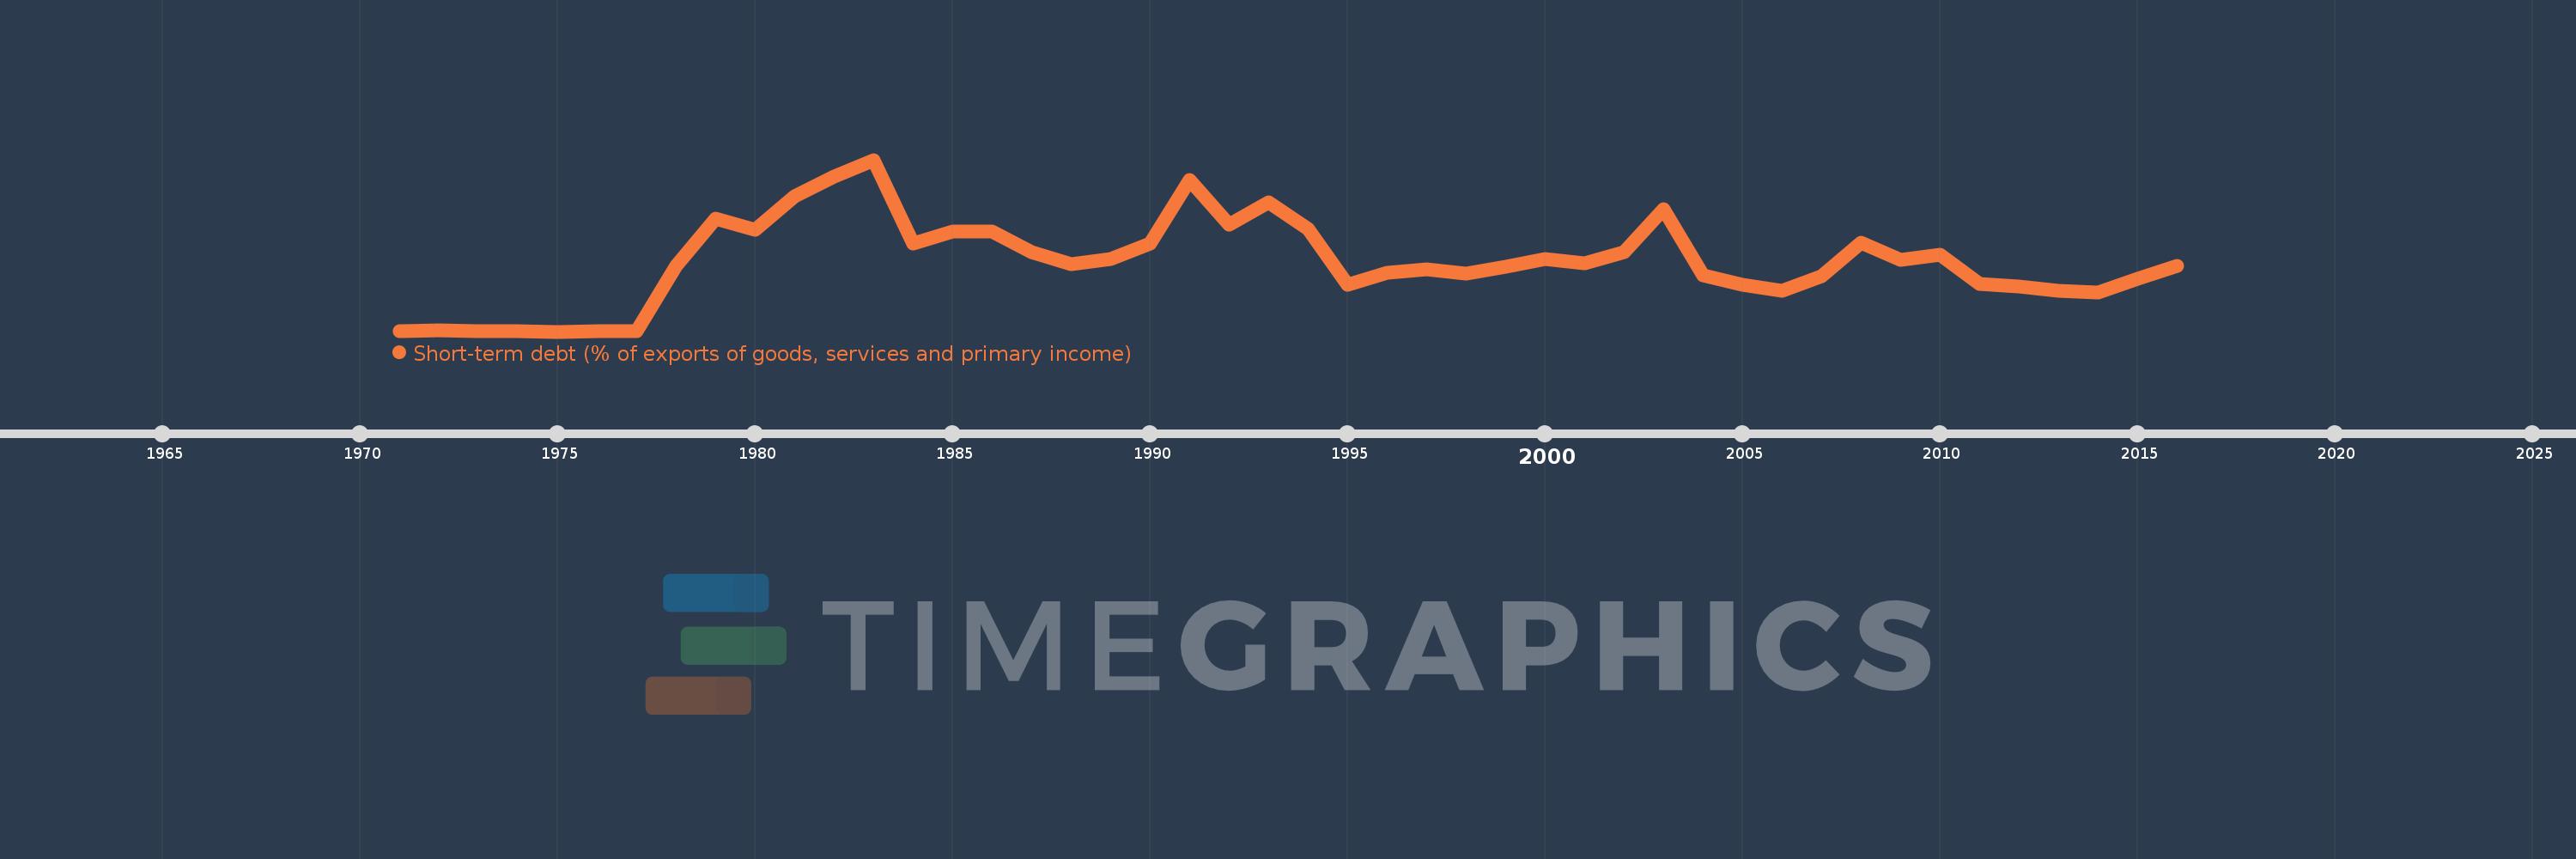
Short-term debt (% of exports of goods, services and primary income)
2016,2015,2014,2013,2012,2011,2010,2009,2008,2007,2006,2005,2004,2003,2002,2001,2000,1999,1998,1997,1996,1995,1994,1993,1992,1991,1990,1989,1988,1987,1986,1985,1984,1983,1982,1981,1980,1979,1978,1977,1976,1975,1974,1973,1972,1971
This statistics in other country:
Timeline:
This timeline shows a graph from 1971 to 2016 of Dominican Republic. No data until 1970. Number of actual observations by date: 46.
Source name:
World Development Indicators
Source organization:
World Bank, International Debt Statistics.
Categories, topics:
Economy & Growth, External Debt
Last updated:
apr 23, 2017
Indicators value changes by year
Maximum:
46.318
jan 1, 1983
At the date of observation
Value
Absolute change
Change from previous value
jan 1, 1971
0.079
+0.079
0.0%
jan 1, 1972
0.285
+0.206
260.56%
jan 1, 1973
0.263
-0.022
-7.58%
jan 1, 1974
0.108
-0.155
-58.98%
jan 1, 1975
0.039
-0.069
-63.56%
jan 1, 1976
0.061
+0.021
54.36%
jan 1, 1977
0.241
+0.18
296.41%
jan 1, 1978
17.804
+17.563
7.3K%
jan 1, 1979
30.409
+12.606
70.8%
jan 1, 1980
27.367
-3.042
-10.0%
jan 1, 1981
36.584
+9.217
33.68%
jan 1, 1982
41.846
+5.262
14.38%
jan 1, 1983
46.318
+4.472
10.69%
jan 1, 1984
23.85
-22.467
-48.51%
jan 1, 1985
26.978
+3.127
13.11%
jan 1, 1986
27.06
+0.082
0.3%
jan 1, 1987
21.443
-5.617
-20.76%
jan 1, 1988
18.197
-3.246
-15.14%
jan 1, 1989
19.533
+1.336
7.34%
jan 1, 1990
23.728
+4.195
21.48%
jan 1, 1991
40.782
+17.055
71.88%
jan 1, 1992
28.906
-11.877
-29.12%
jan 1, 1993
34.951
+6.045
20.91%
jan 1, 1994
27.786
-7.164
-20.5%
jan 1, 1995
12.558
-15.229
-54.81%
jan 1, 1996
15.985
+3.427
27.29%
jan 1, 1997
16.92
+0.935
5.85%
jan 1, 1998
15.681
-1.239
-7.32%
jan 1, 1999
17.478
+1.797
11.46%
jan 1, 2000
19.496
+2.018
11.55%
jan 1, 2001
18.444
-1.052
-5.4%
jan 1, 2002
21.541
+3.097
16.79%
jan 1, 2003
33.071
+11.531
53.53%
jan 1, 2004
15.282
-17.789
-53.79%
jan 1, 2005
12.636
-2.646
-17.32%
jan 1, 2006
11.071
-1.565
-12.39%
jan 1, 2007
15.019
+3.948
35.66%
jan 1, 2008
24.045
+9.026
60.1%
jan 1, 2009
19.401
-4.644
-19.31%
jan 1, 2010
20.784
+1.383
7.13%
jan 1, 2011
12.97
-7.813
-37.59%
jan 1, 2012
12.089
-0.881
-6.79%
jan 1, 2013
11.129
-0.96
-7.94%
jan 1, 2014
10.599
-0.53
-4.76%
jan 1, 2015
14.225
+3.626
34.21%
jan 1, 2016
17.657
+3.432
24.13%
Ranking of countries by current statistics by years


Comments: