29
/
en
AIzaSyAYiBZKx7MnpbEhh9jyipgxe19OcubqV5w
April 1, 2024
44668
Least developed countries: UN classification
LDC
false
2
1
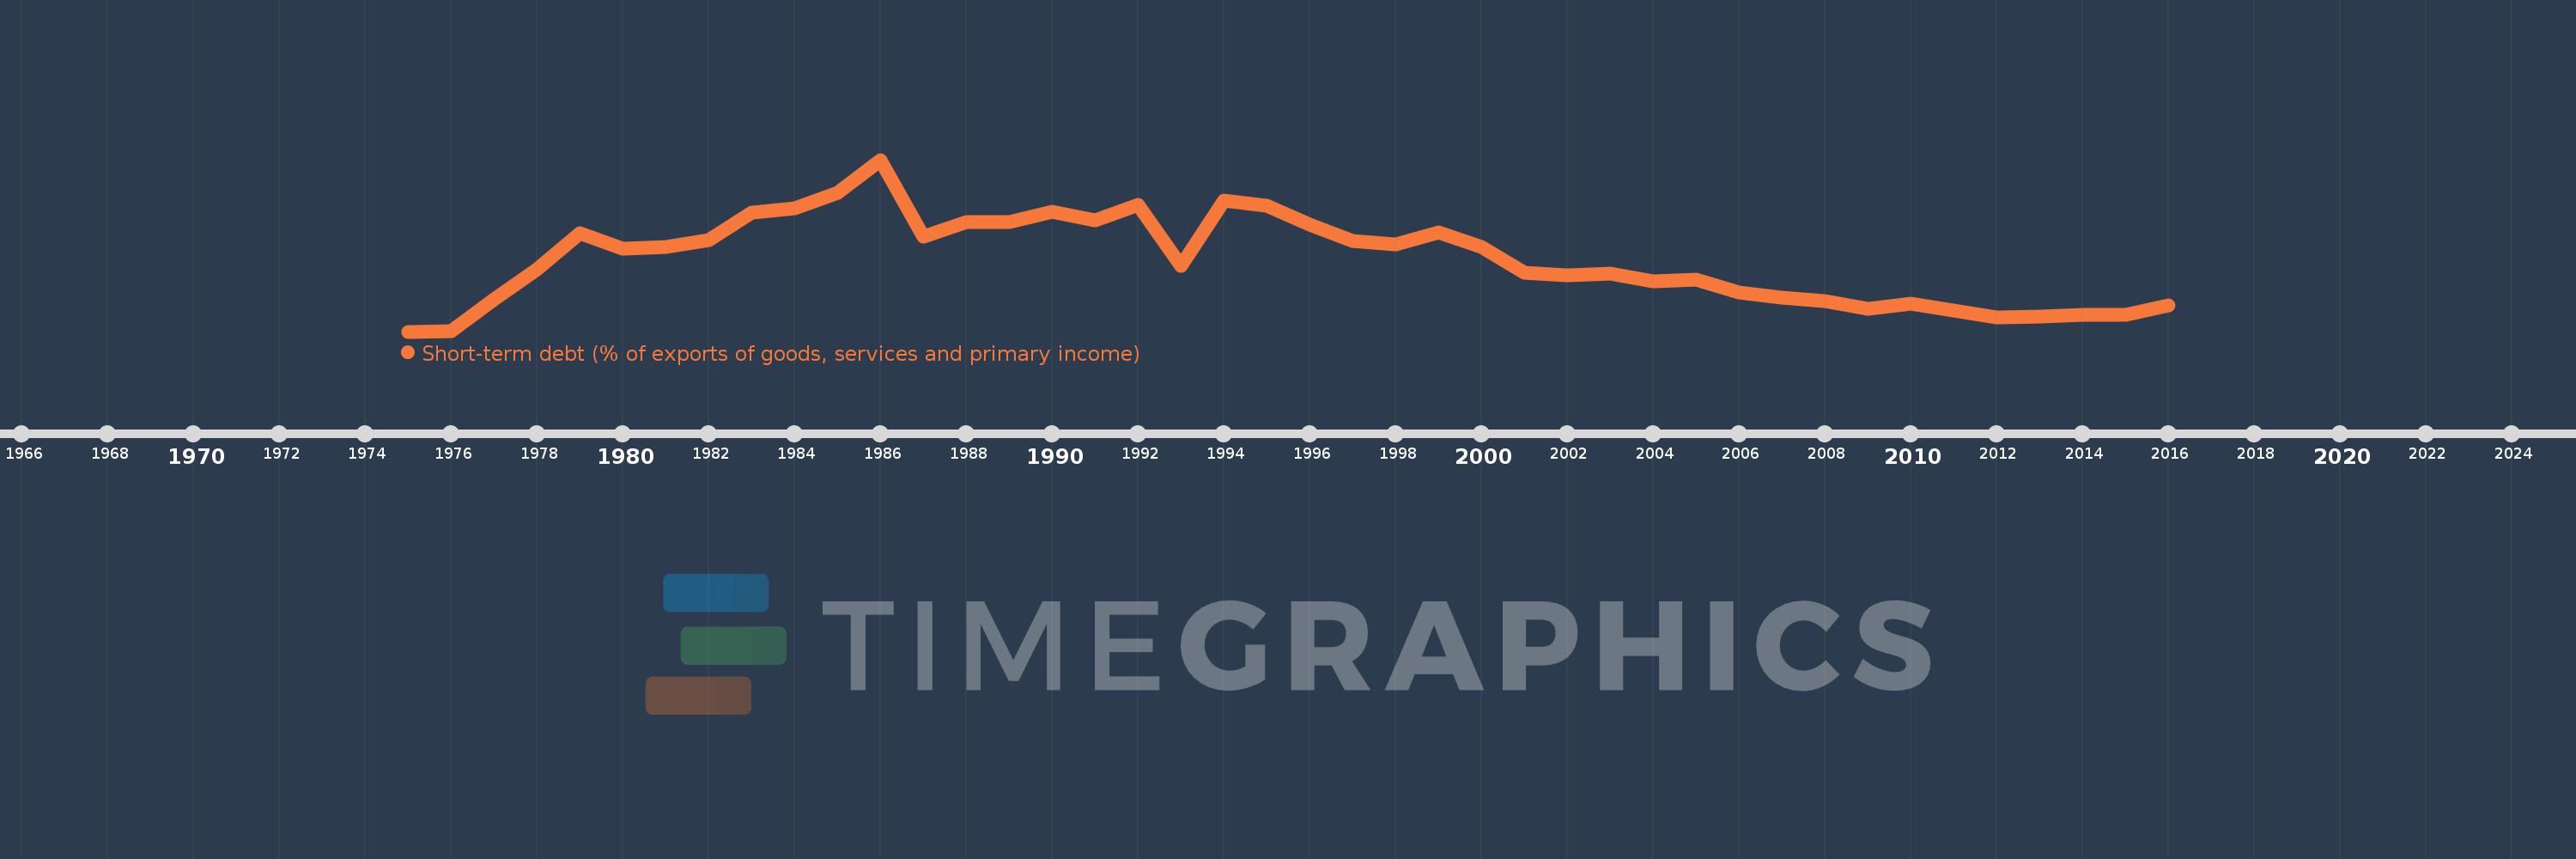
Short-term debt (% of exports of goods, services and primary income)
2016,2015,2014,2013,2012,2011,2010,2009,2008,2007,2006,2005,2004,2003,2002,2001,2000,1999,1998,1997,1996,1995,1994,1993,1992,1991,1990,1989,1988,1987,1986,1985,1984,1983,1982,1981,1980,1979,1978,1977,1976,1975
This statistics in other country:
Timeline:
This timeline shows a graph from 1975 to 2016 of Least developed countries: UN classification. No data until 1974. Number of actual observations by date: 42.
Source name:
World Development Indicators
Source organization:
World Bank, International Debt Statistics.
Categories, topics:
Economy & Growth, External Debt
Last updated:
apr 23, 2017
Indicators value changes by year
At the date of observation
Value
Absolute change
Change from previous value
jan 1, 1975
0.356
+0.356
0.0%
jan 1, 1976
0.378
+0.022
6.1%
jan 1, 1977
15.499
+15.121
4.0K%
jan 1, 1978
29.366
+13.867
89.47%
jan 1, 1979
46.659
+17.293
58.89%
jan 1, 1980
39.086
-7.573
-16.23%
jan 1, 1981
39.925
+0.839
2.15%
jan 1, 1982
43.085
+3.16
7.91%
jan 1, 1983
56.193
+13.108
30.42%
jan 1, 1984
58.022
+1.828
3.25%
jan 1, 1985
65.503
+7.482
12.89%
jan 1, 1986
80.91
+15.407
23.52%
jan 1, 1987
44.938
-35.973
-44.46%
jan 1, 1988
51.81
+6.872
15.29%
jan 1, 1989
51.569
-0.241
-0.47%
jan 1, 1990
56.687
+5.118
9.93%
jan 1, 1991
52.638
-4.049
-7.14%
jan 1, 1992
59.834
+7.197
13.67%
jan 1, 1993
31.248
-28.587
-47.78%
jan 1, 1994
61.897
+30.649
98.09%
jan 1, 1995
59.233
-2.664
-4.3%
jan 1, 1996
50.573
-8.66
-14.62%
jan 1, 1997
42.956
-7.617
-15.06%
jan 1, 1998
41.048
-1.908
-4.44%
jan 1, 1999
46.784
+5.736
13.97%
jan 1, 2000
40.176
-6.608
-14.12%
jan 1, 2001
27.891
-12.285
-30.58%
jan 1, 2002
26.777
-1.114
-3.99%
jan 1, 2003
27.363
+0.586
2.19%
jan 1, 2004
23.952
-3.411
-12.47%
jan 1, 2005
24.714
+0.763
3.18%
jan 1, 2006
18.771
-5.943
-24.05%
jan 1, 2007
16.227
-2.544
-13.55%
jan 1, 2008
14.498
-1.729
-10.65%
jan 1, 2009
11.218
-3.28
-22.62%
jan 1, 2010
13.463
+2.245
20.01%
jan 1, 2011
10.228
-3.235
-24.03%
jan 1, 2012
6.846
-3.382
-33.07%
jan 1, 2013
7.246
+0.401
5.85%
jan 1, 2014
8.124
+0.878
12.11%
jan 1, 2015
8.299
+0.175
2.16%
jan 1, 2016
12.819
+4.52
54.46%
Ranking of countries by current statistics by years


Comments: