29
/
en
AIzaSyAYiBZKx7MnpbEhh9jyipgxe19OcubqV5w
April 1, 2024
168224
Kenya
KEN
true
2
1
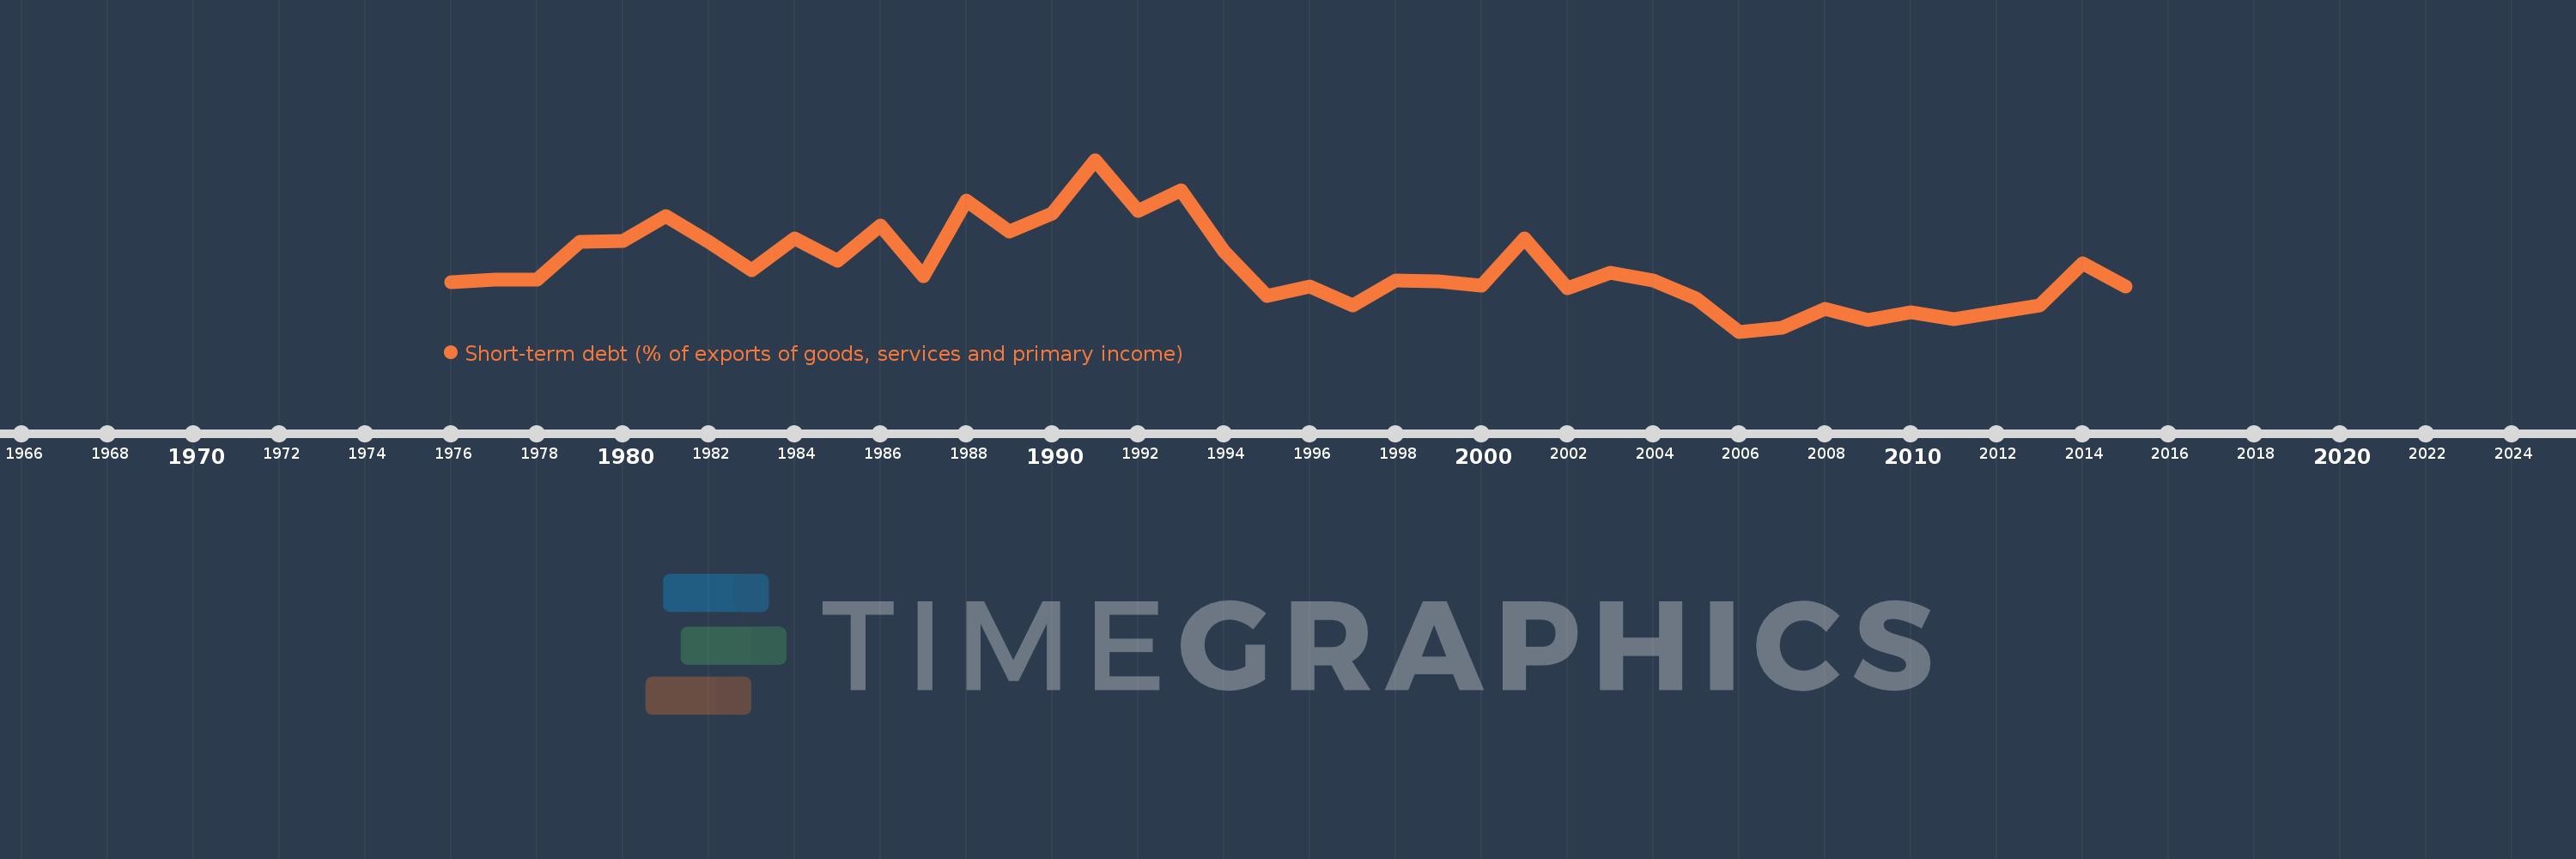
Short-term debt (% of exports of goods, services and primary income)
2015,2014,2013,2012,2011,2010,2009,2008,2007,2006,2005,2004,2003,2002,2001,2000,1999,1998,1997,1996,1995,1994,1993,1992,1991,1990,1989,1988,1987,1986,1985,1984,1983,1982,1981,1980,1979,1978,1977,1976
This statistics in other country:
Timeline:
This timeline shows a graph from 1976 to 2015 of Kenya. No data until 1975. Number of actual observations by date: 40.
Source name:
World Development Indicators
Source organization:
World Bank, International Debt Statistics.
Categories, topics:
Economy & Growth, External Debt
Last updated:
apr 23, 2017
Indicators value changes by year
Maximum:
41.834
jan 1, 1991
At the date of observation
Value
Absolute change
Change from previous value
jan 1, 1976
18.494
+18.494
0.0%
jan 1, 1977
18.9
+0.406
2.19%
jan 1, 1978
19.01
+0.11
0.58%
jan 1, 1979
26.108
+7.098
37.34%
jan 1, 1980
26.329
+0.221
0.85%
jan 1, 1981
31.067
+4.738
18.0%
jan 1, 1982
26.145
-4.922
-15.84%
jan 1, 1983
20.833
-5.312
-20.32%
jan 1, 1984
26.784
+5.951
28.56%
jan 1, 1985
22.61
-4.174
-15.58%
jan 1, 1986
29.254
+6.644
29.39%
jan 1, 1987
19.556
-9.698
-33.15%
jan 1, 1988
34.032
+14.476
74.02%
jan 1, 1989
28.229
-5.803
-17.05%
jan 1, 1990
31.529
+3.3
11.69%
jan 1, 1991
41.834
+10.305
32.68%
jan 1, 1992
32.079
-9.754
-23.32%
jan 1, 1993
36.087
+4.007
12.49%
jan 1, 1994
24.367
-11.72
-32.48%
jan 1, 1995
15.8
-8.567
-35.16%
jan 1, 1996
17.696
+1.896
12.0%
jan 1, 1997
14.105
-3.591
-20.29%
jan 1, 1998
18.871
+4.766
33.79%
jan 1, 1999
18.698
-0.172
-0.91%
jan 1, 2000
17.753
-0.945
-5.05%
jan 1, 2001
26.829
+9.076
51.12%
jan 1, 2002
17.32
-9.508
-35.44%
jan 1, 2003
20.251
+2.93
16.92%
jan 1, 2004
18.853
-1.397
-6.9%
jan 1, 2005
15.302
-3.551
-18.84%
jan 1, 2006
9.052
-6.251
-40.85%
jan 1, 2007
9.756
+0.704
7.78%
jan 1, 2008
13.39
+3.634
37.25%
jan 1, 2009
11.224
-2.166
-16.17%
jan 1, 2010
12.694
+1.47
13.09%
jan 1, 2011
11.409
-1.285
-10.12%
jan 1, 2012
12.761
+1.352
11.85%
jan 1, 2013
14.071
+1.31
10.27%
jan 1, 2014
22.096
+8.025
57.04%
jan 1, 2015
17.72
-4.376
-19.81%
Ranking of countries by current statistics by years


Comments: