29
/
en
AIzaSyAYiBZKx7MnpbEhh9jyipgxe19OcubqV5w
April 1, 2024
237830
Serbia
SRB
true
2
1
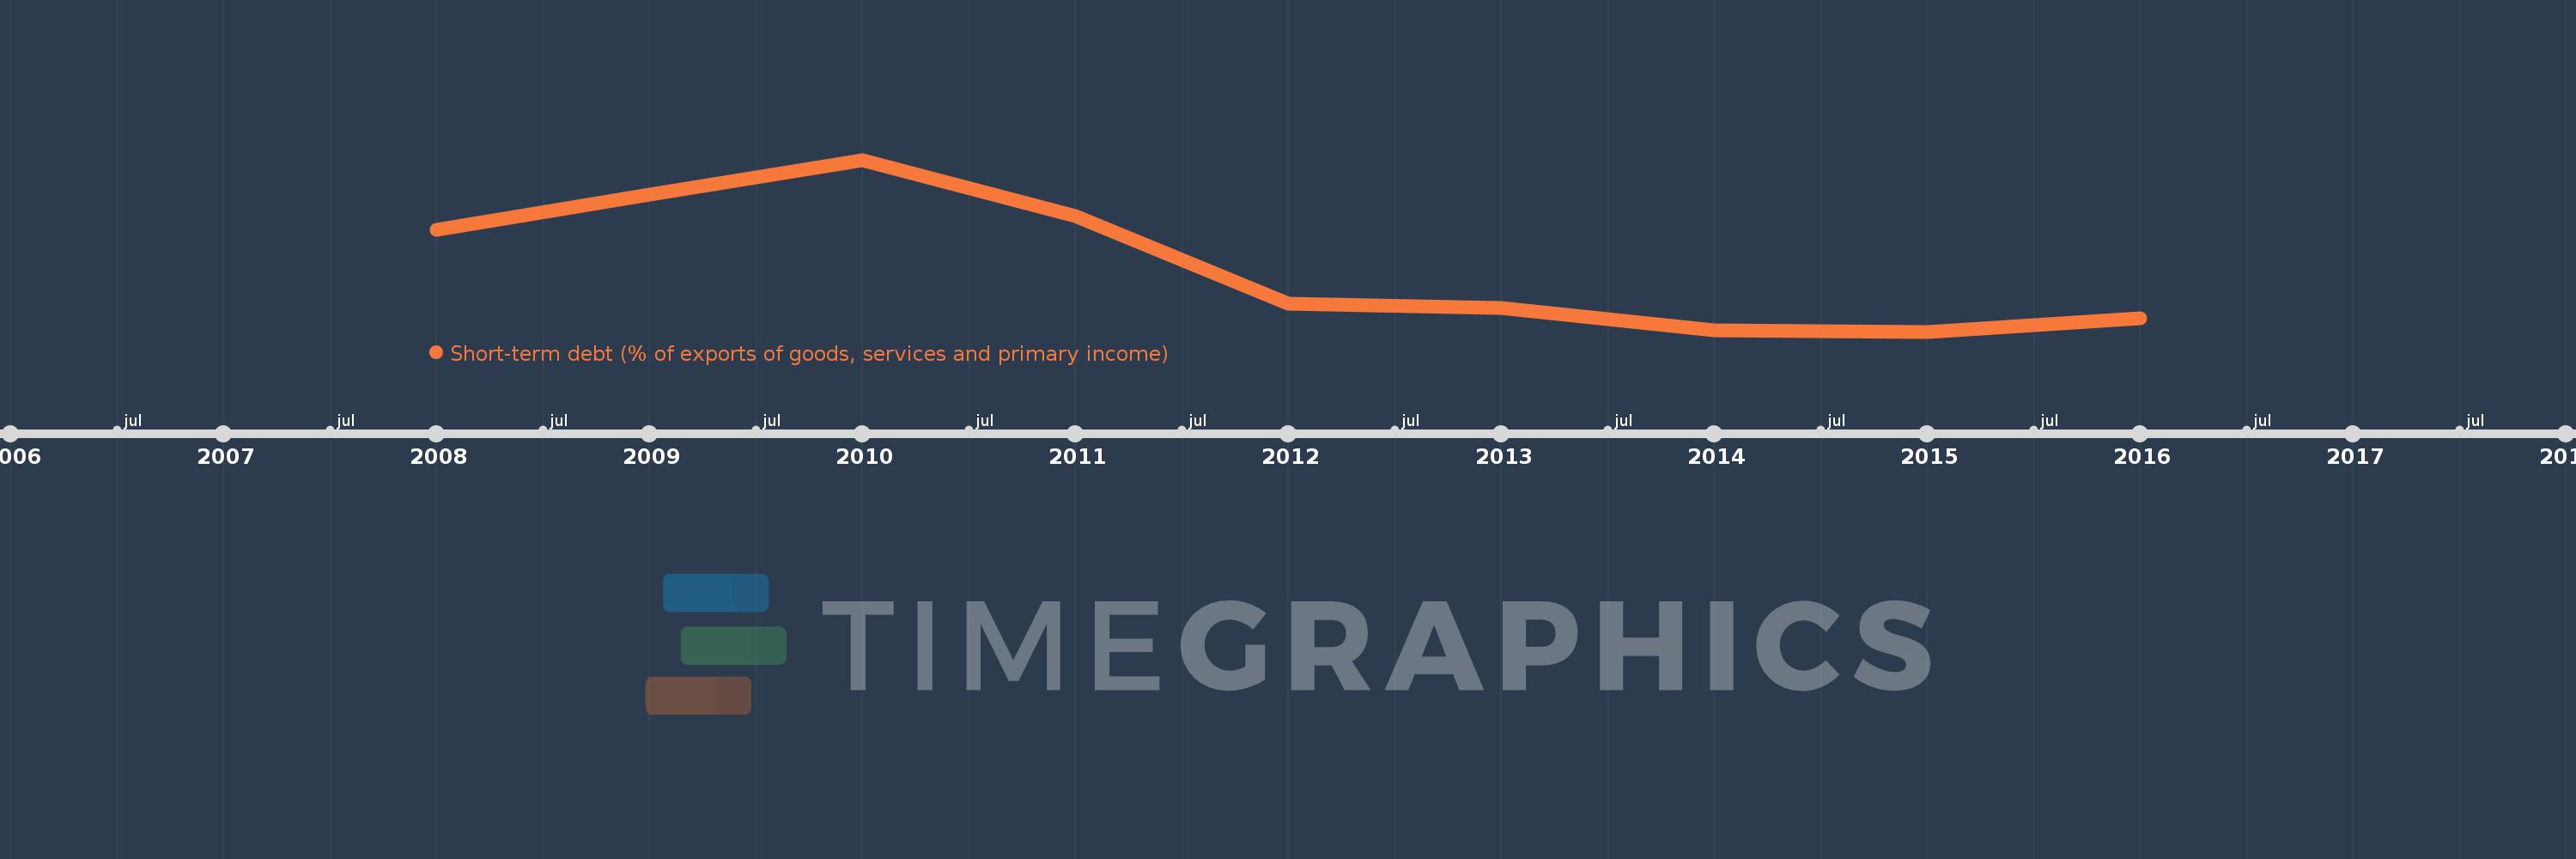
Short-term debt (% of exports of goods, services and primary income)
2016,2015,2014,2013,2012,2011,2010,2009,2008
This statistics in other country:
Timeline:
This timeline shows a graph from 2008 to 2016 of Serbia. No data until 2007. Number of actual observations by date: 9.
Source name:
World Development Indicators
Source organization:
World Bank, International Debt Statistics.
Categories, topics:
Economy & Growth, External Debt
Last updated:
apr 23, 2017
Indicators value changes by year
At the date of observation
Value
Absolute change
Change from previous value
jan 1, 2008
18.974
+18.974
0.0%
jan 1, 2009
24.656
+5.682
29.95%
jan 1, 2010
30.22
+5.564
22.57%
jan 1, 2011
21.252
-8.969
-29.68%
jan 1, 2012
7.165
-14.087
-66.29%
jan 1, 2013
6.532
-0.632
-8.83%
jan 1, 2014
2.954
-3.578
-54.78%
jan 1, 2015
2.69
-0.264
-8.95%
jan 1, 2016
4.884
+2.194
81.58%
Ranking of countries by current statistics by years


Comments: