29
/
en
AIzaSyAYiBZKx7MnpbEhh9jyipgxe19OcubqV5w
April 1, 2024
253692
Sudan
SDN
true
2
1
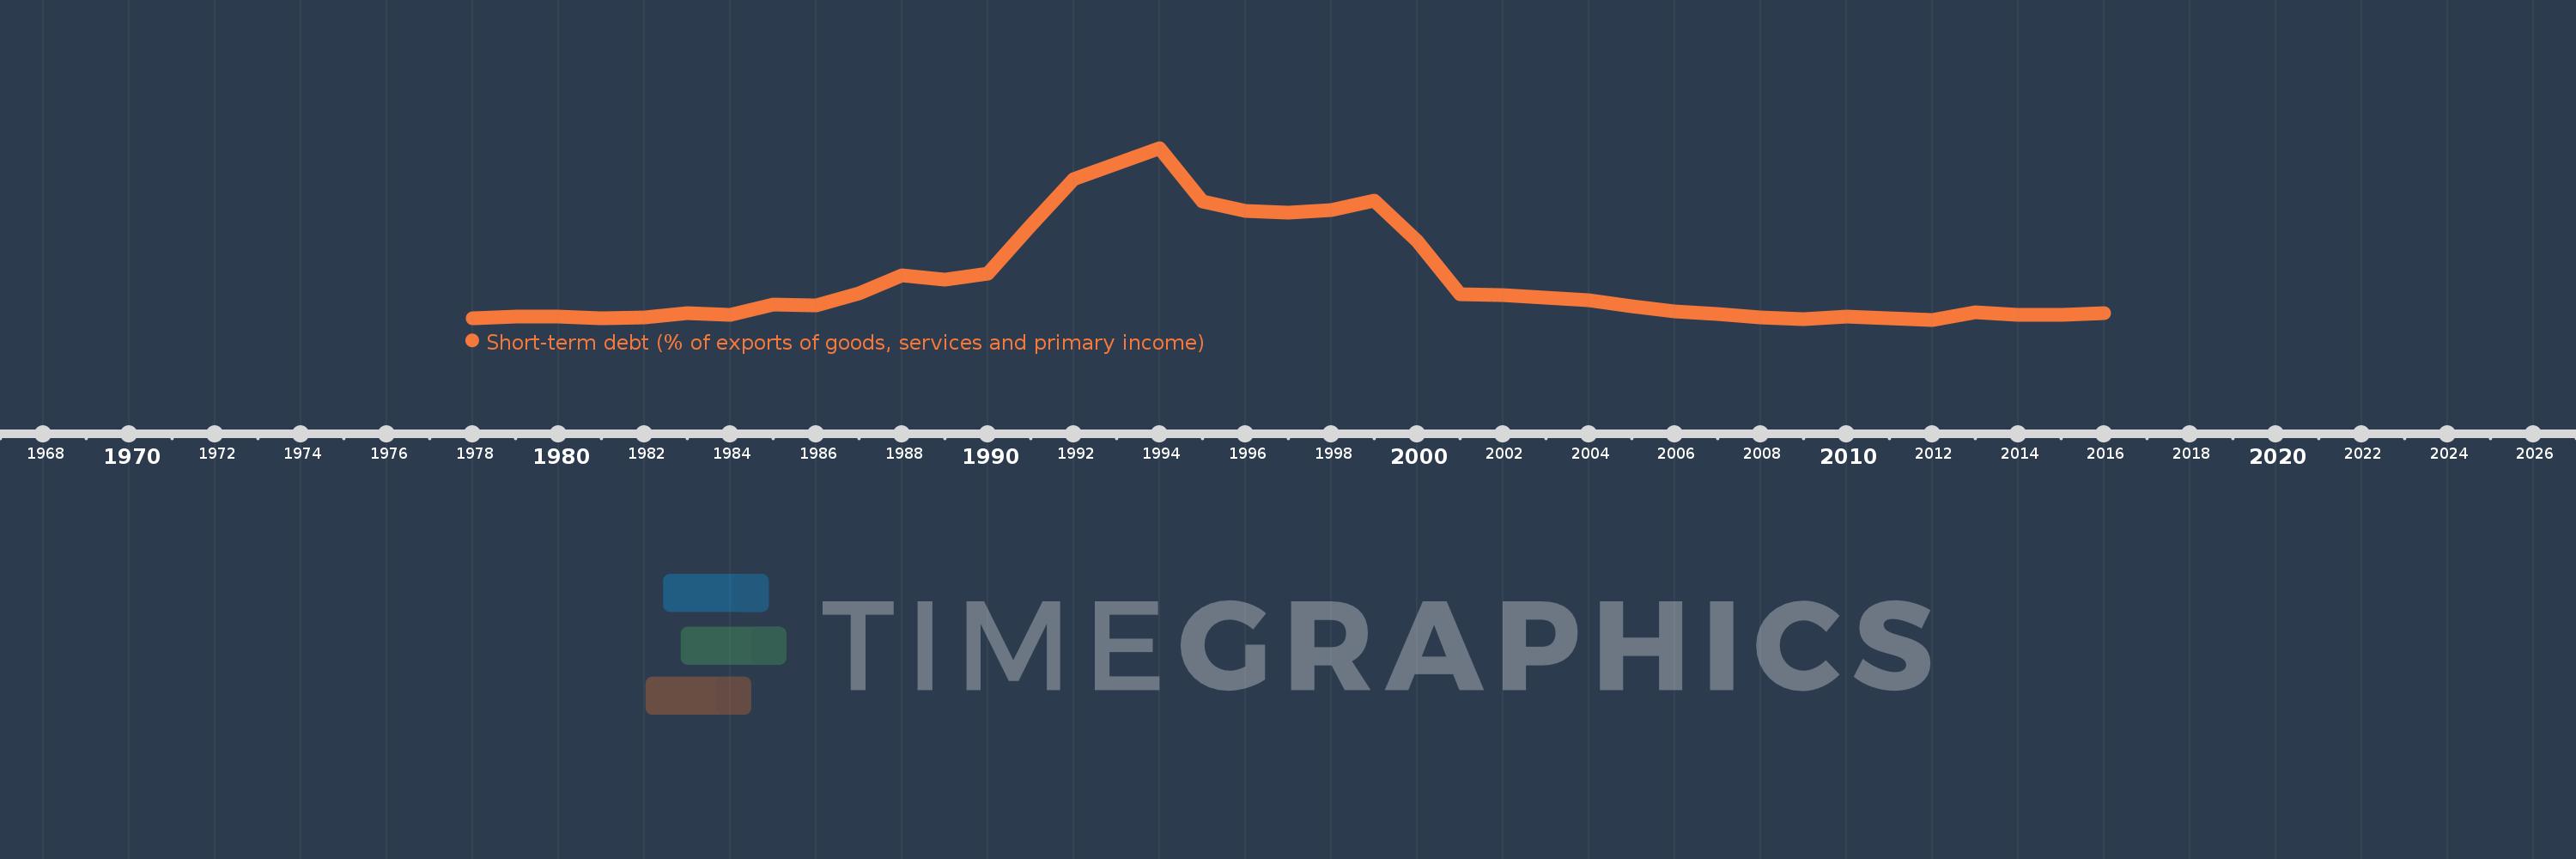
Short-term debt (% of exports of goods, services and primary income)
2016,2015,2014,2013,2012,2011,2010,2009,2008,2007,2006,2005,2004,2003,2002,2001,2000,1999,1998,1997,1996,1995,1994,1992,1991,1990,1989,1988,1987,1986,1985,1984,1983,1982,1981,1980,1979,1978
This statistics in other country:
Timeline:
This timeline shows a graph from 1978 to 2016 of Sudan. No data until 1977. Number of actual observations by date: 38.
Source name:
World Development Indicators
Source organization:
World Bank, International Debt Statistics.
Categories, topics:
Economy & Growth, External Debt
Last updated:
apr 23, 2017
Indicators value changes by year
Minimum:
48.951
jan 1, 2012
Maximum:
1.441K
jan 1, 1994
At the date of observation
Value
Absolute change
Change from previous value
jan 1, 1978
58.828
+58.828
0.0%
jan 1, 1979
74.915
+16.087
27.35%
jan 1, 1980
72.663
-2.252
-3.01%
jan 1, 1981
58.073
-14.59
-20.08%
jan 1, 1982
69.747
+11.674
20.1%
jan 1, 1983
100.62
+30.873
44.26%
jan 1, 1984
89.787
-10.832
-10.77%
jan 1, 1985
175.459
+85.671
95.42%
jan 1, 1986
165.034
-10.425
-5.94%
jan 1, 1987
259.719
+94.685
57.37%
jan 1, 1988
411.014
+151.294
58.25%
jan 1, 1989
375.698
-35.315
-8.59%
jan 1, 1990
426.009
+50.311
13.39%
jan 1, 1991
812.522
+386.513
90.73%
jan 1, 1992
1.19K
+377.946
46.52%
jan 1, 1994
1.441K
+250.594
21.05%
jan 1, 1995
1.004K
-436.963
-30.32%
jan 1, 1996
932.507
-71.592
-7.13%
jan 1, 1997
917.375
-15.132
-1.62%
jan 1, 1998
939.179
+21.803
2.38%
jan 1, 1999
1.016K
+76.342
8.13%
jan 1, 2000
689.088
-326.433
-32.14%
jan 1, 2001
257.595
-431.492
-62.62%
jan 1, 2002
250.081
-7.515
-2.92%
jan 1, 2003
228.67
-21.411
-8.56%
jan 1, 2004
209.598
-19.072
-8.34%
jan 1, 2005
156.012
-53.586
-25.57%
jan 1, 2006
114.327
-41.685
-26.72%
jan 1, 2007
98.188
-16.139
-14.12%
jan 1, 2008
67.215
-30.973
-31.54%
jan 1, 2009
54.938
-12.277
-18.27%
jan 1, 2010
77.501
+22.563
41.07%
jan 1, 2011
60.912
-16.588
-21.4%
jan 1, 2012
48.951
-11.962
-19.64%
jan 1, 2013
106.133
+57.182
116.82%
jan 1, 2014
89.66
-16.473
-15.52%
jan 1, 2015
86.629
-3.032
-3.38%
jan 1, 2016
102.011
+15.382
17.76%
Ranking of countries by current statistics by years


Comments: