29
/
en
AIzaSyAYiBZKx7MnpbEhh9jyipgxe19OcubqV5w
April 1, 2024
212392
Niger
NER
true
2
1
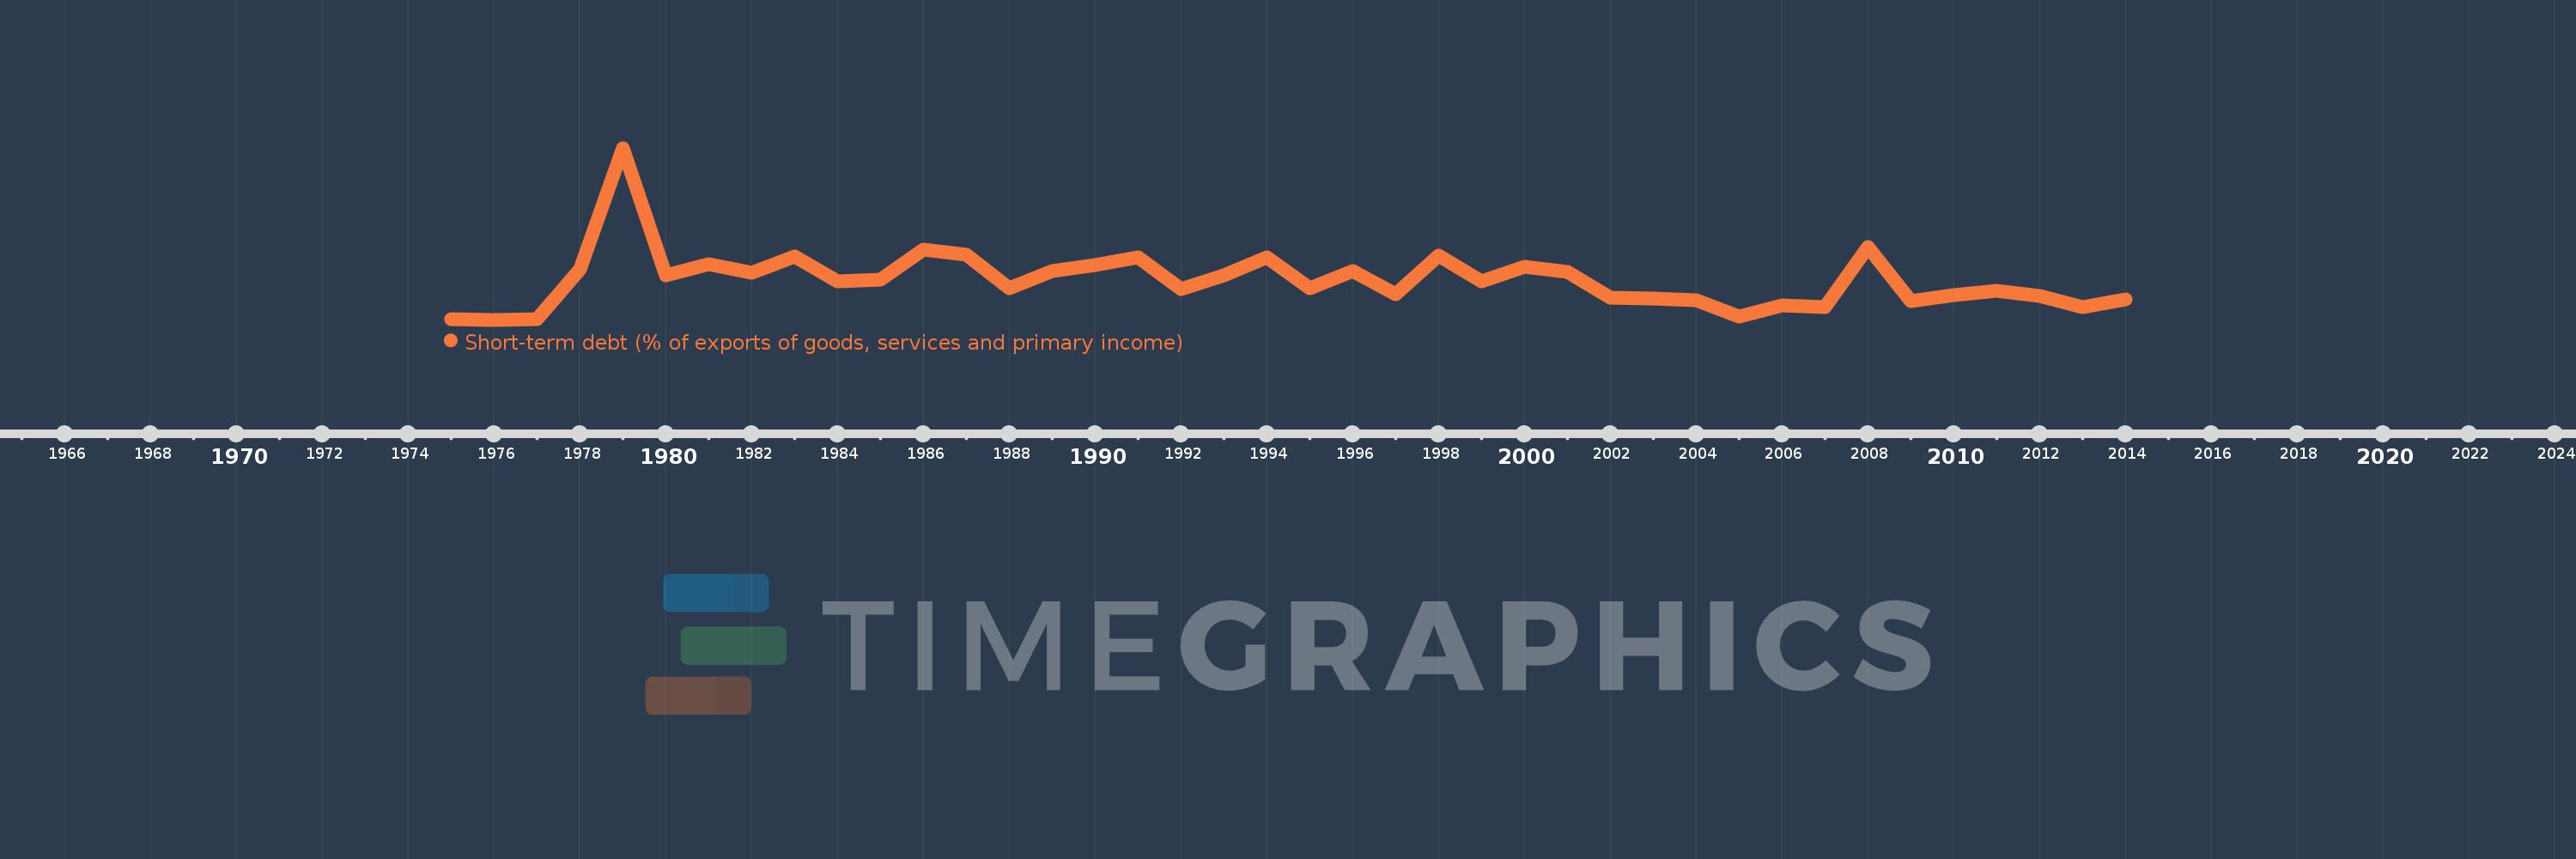
Short-term debt (% of exports of goods, services and primary income)
2014,2013,2012,2011,2010,2009,2008,2007,2006,2005,2004,2003,2002,2001,2000,1999,1998,1997,1996,1995,1994,1993,1992,1991,1990,1989,1988,1987,1986,1985,1984,1983,1982,1981,1980,1979,1978,1977,1976,1975
This statistics in other country:
Timeline:
This timeline shows a graph from 1975 to 2014 of Niger. No data until 1974. Number of actual observations by date: 40.
Source name:
World Development Indicators
Source organization:
World Bank, International Debt Statistics.
Categories, topics:
Economy & Growth, External Debt
Last updated:
apr 23, 2017
Indicators value changes by year
At the date of observation
Value
Absolute change
Change from previous value
jan 1, 1975
0.328
+0.328
0.0%
jan 1, 1976
0.196
-0.132
-40.16%
jan 1, 1977
0.307
+0.11
56.23%
jan 1, 1978
22.485
+22.178
7.23K%
jan 1, 1979
76.25
+53.765
239.12%
jan 1, 1980
19.947
-56.303
-73.84%
jan 1, 1981
24.742
+4.795
24.04%
jan 1, 1982
20.968
-3.774
-15.25%
jan 1, 1983
28.052
+7.084
33.78%
jan 1, 1984
17.074
-10.978
-39.13%
jan 1, 1985
18.039
+0.966
5.66%
jan 1, 1986
31.254
+13.214
73.25%
jan 1, 1987
29.129
-2.125
-6.8%
jan 1, 1988
13.98
-15.149
-52.01%
jan 1, 1989
21.724
+7.744
55.39%
jan 1, 1990
24.286
+2.562
11.79%
jan 1, 1991
27.736
+3.449
14.2%
jan 1, 1992
13.786
-13.949
-50.29%
jan 1, 1993
19.881
+6.095
44.21%
jan 1, 1994
27.902
+8.021
40.34%
jan 1, 1995
14.262
-13.641
-48.89%
jan 1, 1996
21.662
+7.401
51.89%
jan 1, 1997
11.537
-10.126
-46.74%
jan 1, 1998
28.747
+17.211
149.19%
jan 1, 1999
17.24
-11.508
-40.03%
jan 1, 2000
23.525
+6.286
36.46%
jan 1, 2001
21.553
-1.972
-8.38%
jan 1, 2002
9.926
-11.627
-53.94%
jan 1, 2003
9.77
-0.157
-1.58%
jan 1, 2004
8.768
-1.002
-10.26%
jan 1, 2005
1.605
-7.163
-81.7%
jan 1, 2006
6.565
+4.961
309.16%
jan 1, 2007
5.976
-0.589
-8.98%
jan 1, 2008
32.406
+26.43
442.28%
jan 1, 2009
8.262
-24.144
-74.5%
jan 1, 2010
11.011
+2.748
33.26%
jan 1, 2011
12.945
+1.935
17.57%
jan 1, 2012
10.842
-2.103
-16.25%
jan 1, 2013
5.891
-4.951
-45.66%
jan 1, 2014
9.085
+3.194
54.21%
Ranking of countries by current statistics by years


Comments: