29
/
en
AIzaSyAYiBZKx7MnpbEhh9jyipgxe19OcubqV5w
April 1, 2024
39555
IDA only
IDX
false
2
1
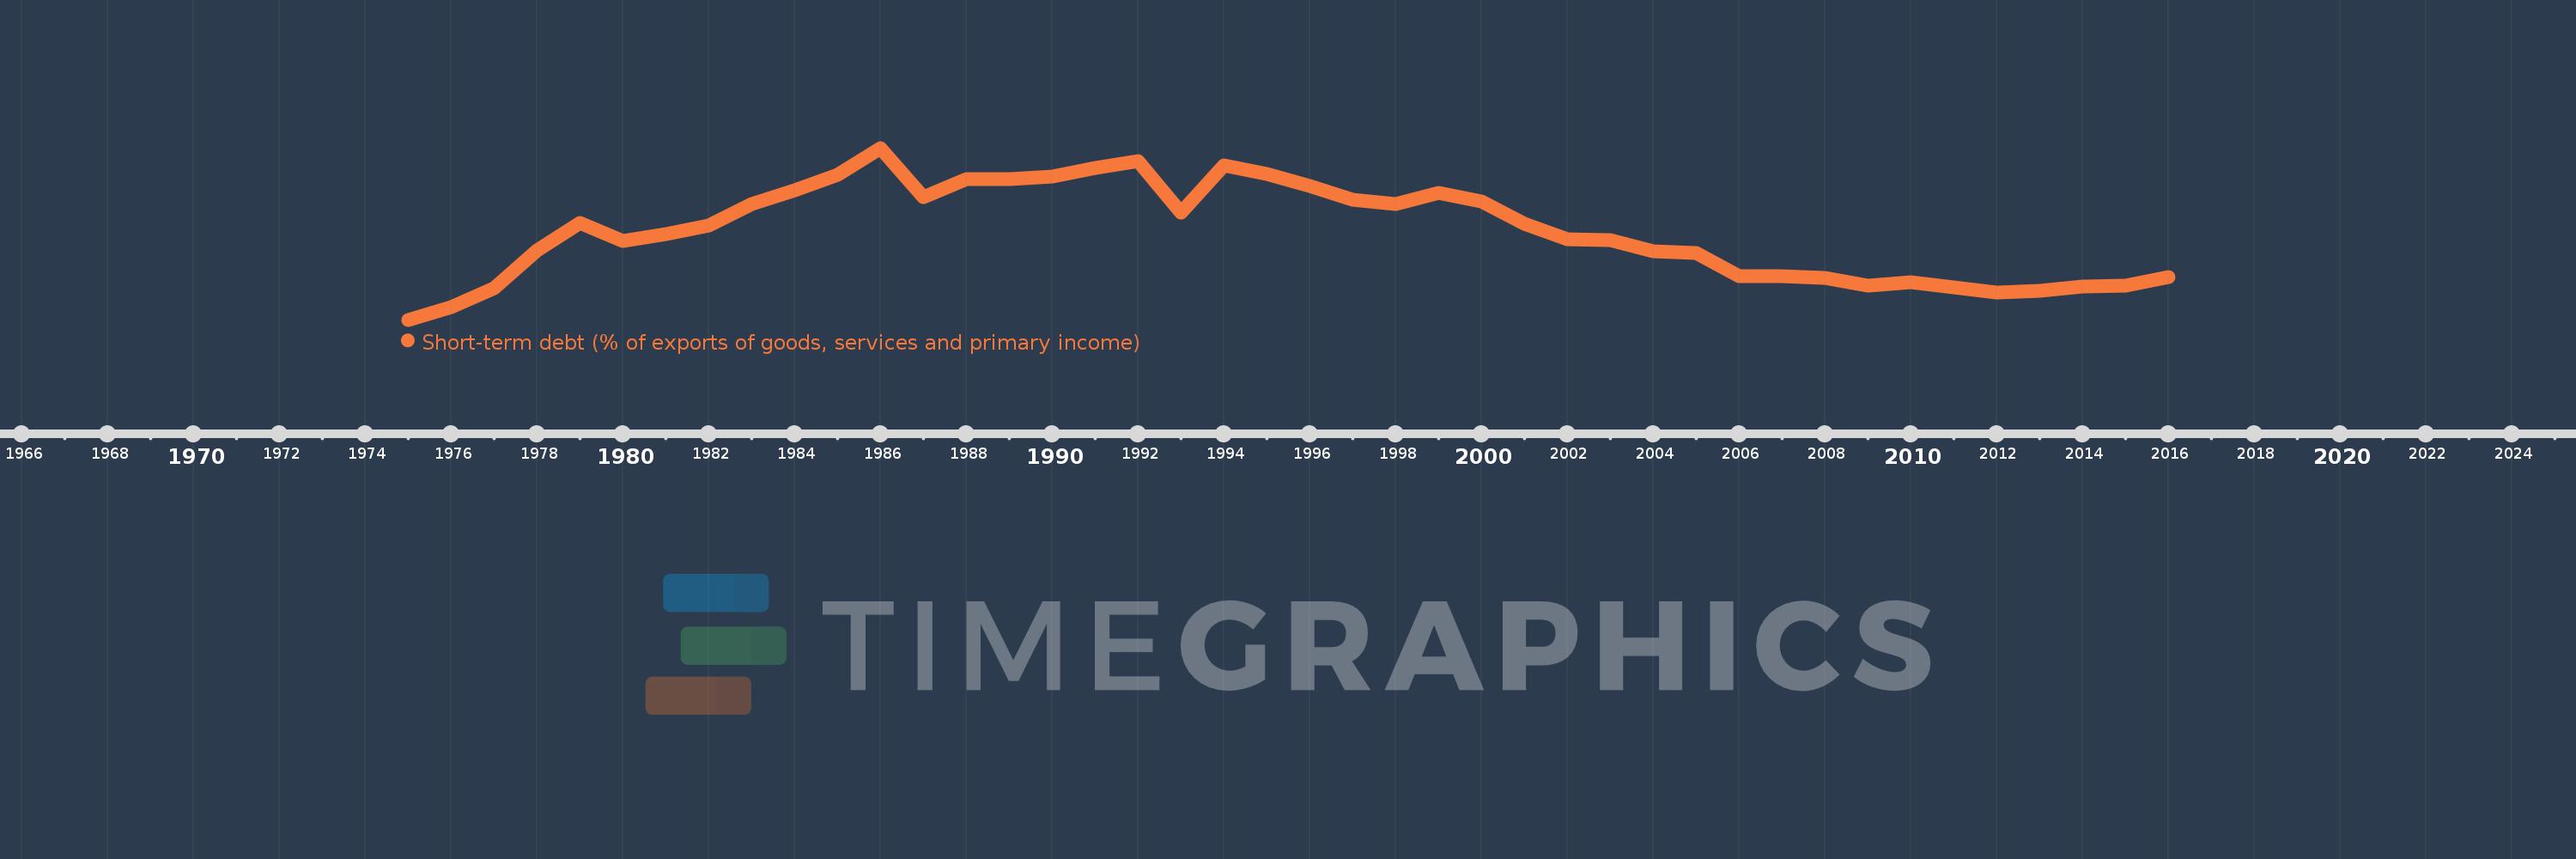
Short-term debt (% of exports of goods, services and primary income)
2016,2015,2014,2013,2012,2011,2010,2009,2008,2007,2006,2005,2004,2003,2002,2001,2000,1999,1998,1997,1996,1995,1994,1993,1992,1991,1990,1989,1988,1987,1986,1985,1984,1983,1982,1981,1980,1979,1978,1977,1976,1975
This statistics in other country:
Timeline:
This timeline shows a graph from 1975 to 2016 of IDA only. No data until 1974. Number of actual observations by date: 42.
Source name:
World Development Indicators
Source organization:
World Bank, International Debt Statistics.
Categories, topics:
Economy & Growth, External Debt
Last updated:
apr 23, 2017
Indicators value changes by year
Maximum:
68.155
jan 1, 1986
At the date of observation
Value
Absolute change
Change from previous value
jan 1, 1975
0.356
+0.356
0.0%
jan 1, 1976
5.286
+4.93
1.38K%
jan 1, 1977
12.696
+7.41
140.17%
jan 1, 1978
27.769
+15.072
118.72%
jan 1, 1979
38.708
+10.939
39.39%
jan 1, 1980
31.469
-7.239
-18.7%
jan 1, 1981
34.153
+2.684
8.53%
jan 1, 1982
37.518
+3.366
9.85%
jan 1, 1983
46.13
+8.612
22.95%
jan 1, 1984
51.317
+5.186
11.24%
jan 1, 1985
57.654
+6.337
12.35%
jan 1, 1986
68.155
+10.502
18.21%
jan 1, 1987
48.724
-19.431
-28.51%
jan 1, 1988
55.798
+7.074
14.52%
jan 1, 1989
55.695
-0.103
-0.19%
jan 1, 1990
56.884
+1.19
2.14%
jan 1, 1991
60.175
+3.29
5.78%
jan 1, 1992
63.105
+2.93
4.87%
jan 1, 1993
42.49
-20.615
-32.67%
jan 1, 1994
61.235
+18.745
44.12%
jan 1, 1995
57.928
-3.307
-5.4%
jan 1, 1996
53.09
-4.838
-8.35%
jan 1, 1997
47.708
-5.382
-10.14%
jan 1, 1998
45.951
-1.756
-3.68%
jan 1, 1999
50.534
+4.582
9.97%
jan 1, 2000
46.958
-3.576
-7.08%
jan 1, 2001
38.124
-8.834
-18.81%
jan 1, 2002
32.192
-5.932
-15.56%
jan 1, 2003
31.692
-0.5
-1.55%
jan 1, 2004
27.507
-4.185
-13.21%
jan 1, 2005
26.557
-0.95
-3.45%
jan 1, 2006
17.538
-9.019
-33.96%
jan 1, 2007
17.519
-0.019
-0.11%
jan 1, 2008
16.962
-0.557
-3.18%
jan 1, 2009
13.878
-3.084
-18.18%
jan 1, 2010
15.053
+1.175
8.46%
jan 1, 2011
13.177
-1.876
-12.46%
jan 1, 2012
11.137
-2.04
-15.48%
jan 1, 2013
11.901
+0.764
6.86%
jan 1, 2014
13.387
+1.486
12.48%
jan 1, 2015
13.698
+0.311
2.32%
jan 1, 2016
17.243
+3.546
25.89%
Ranking of countries by current statistics by years


Comments: