29
/
en
AIzaSyAYiBZKx7MnpbEhh9jyipgxe19OcubqV5w
April 1, 2024
108006
Colombia
COL
true
2
1
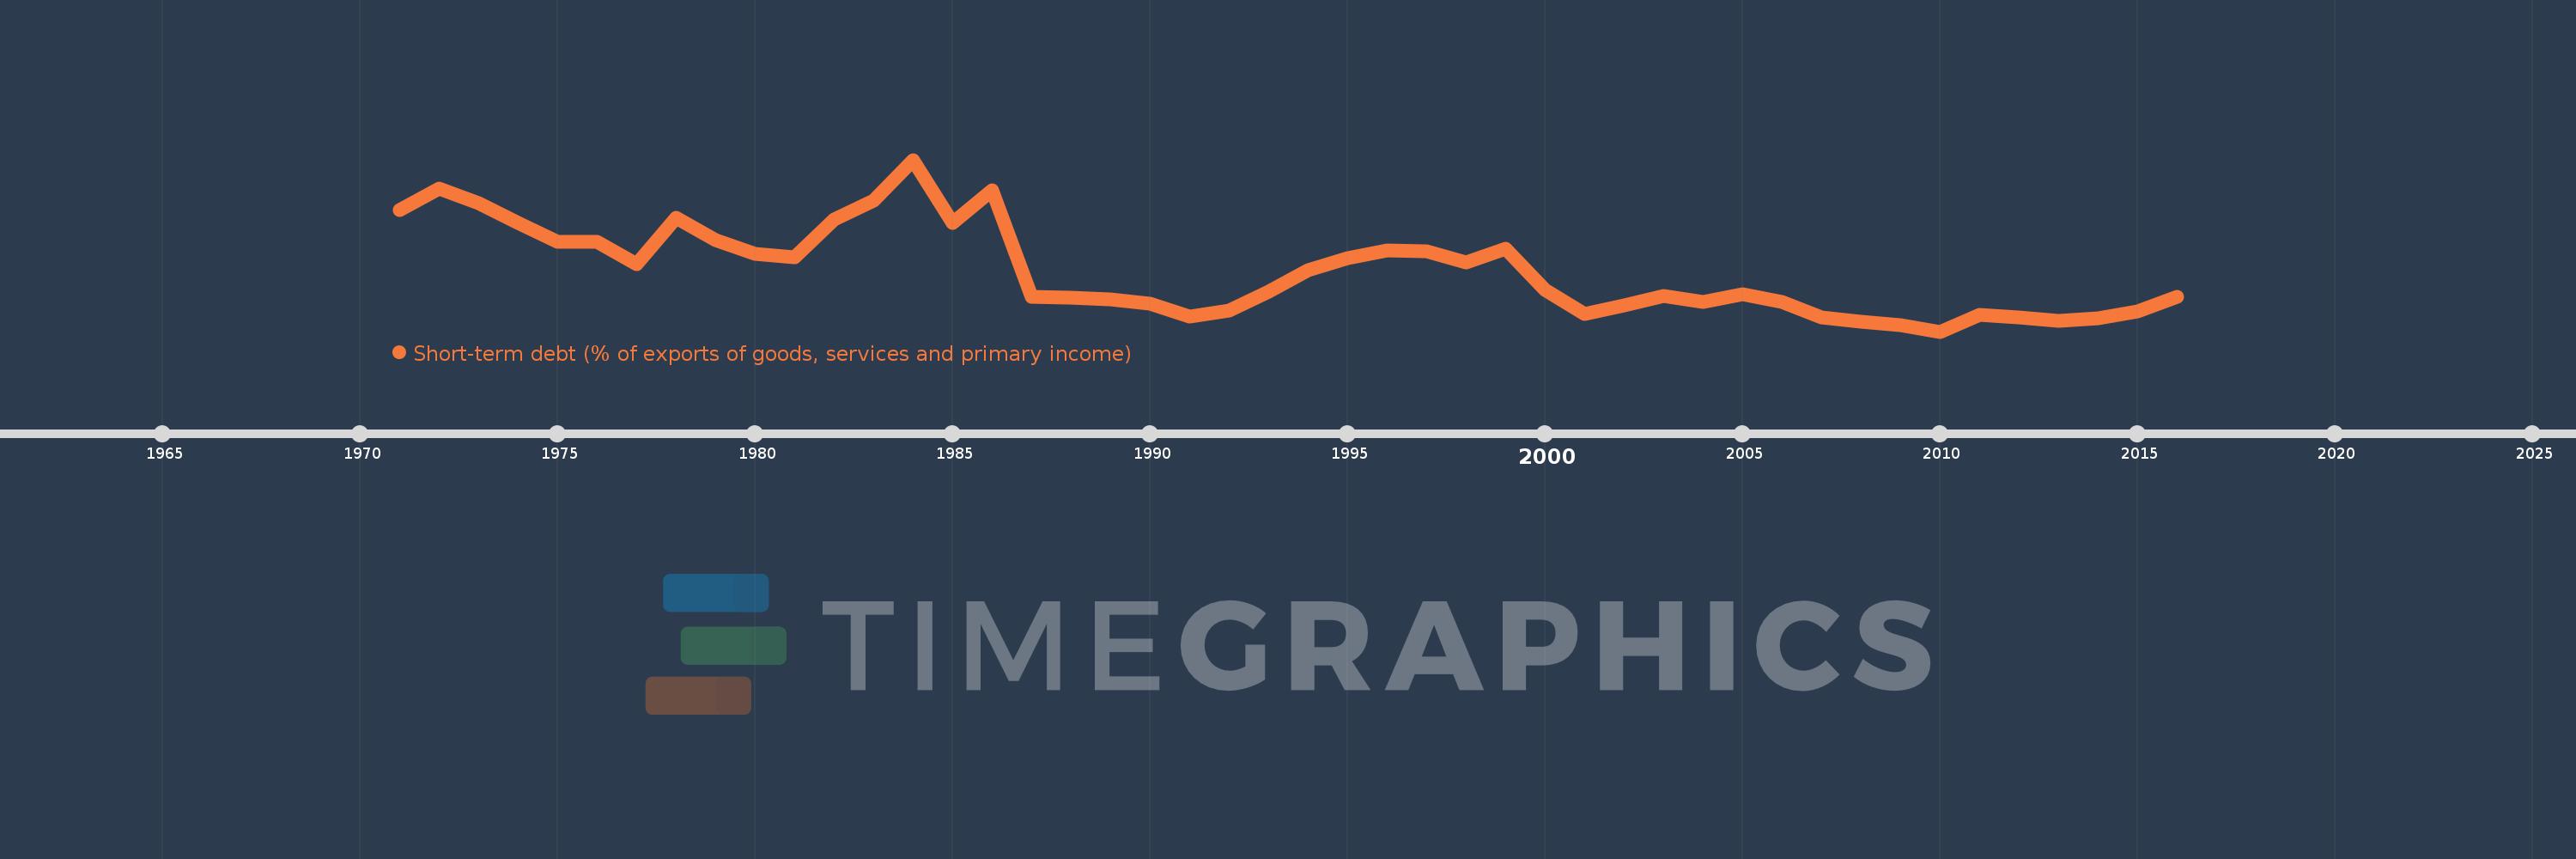
Short-term debt (% of exports of goods, services and primary income)
2016,2015,2014,2013,2012,2011,2010,2009,2008,2007,2006,2005,2004,2003,2002,2001,2000,1999,1998,1997,1996,1995,1994,1993,1992,1991,1990,1989,1988,1987,1986,1985,1984,1983,1982,1981,1980,1979,1978,1977,1976,1975,1974,1973,1972,1971
This statistics in other country:
Timeline:
This timeline shows a graph from 1971 to 2016 of Colombia. No data until 1970. Number of actual observations by date: 46.
Source name:
World Development Indicators
Source organization:
World Bank, International Debt Statistics.
Categories, topics:
Economy & Growth, External Debt
Last updated:
apr 23, 2017
Indicators value changes by year
Maximum:
79.454
jan 1, 1984
At the date of observation
Value
Absolute change
Change from previous value
jan 1, 1971
59.078
+59.078
0.0%
jan 1, 1972
67.911
+8.834
14.95%
jan 1, 1973
61.957
-5.955
-8.77%
jan 1, 1974
53.841
-8.115
-13.1%
jan 1, 1975
46.255
-7.586
-14.09%
jan 1, 1976
46.414
+0.159
0.34%
jan 1, 1977
37.265
-9.149
-19.71%
jan 1, 1978
56.082
+18.817
50.49%
jan 1, 1979
47.006
-9.076
-16.18%
jan 1, 1980
41.476
-5.53
-11.76%
jan 1, 1981
39.878
-1.599
-3.85%
jan 1, 1982
55.324
+15.447
38.73%
jan 1, 1983
62.805
+7.481
13.52%
jan 1, 1984
79.454
+16.649
26.51%
jan 1, 1985
53.829
-25.625
-32.25%
jan 1, 1986
67.246
+13.418
24.93%
jan 1, 1987
24.146
-43.1
-64.09%
jan 1, 1988
23.558
-0.587
-2.43%
jan 1, 1989
22.98
-0.579
-2.46%
jan 1, 1990
21.25
-1.73
-7.53%
jan 1, 1991
15.936
-5.314
-25.01%
jan 1, 1992
18.452
+2.516
15.79%
jan 1, 1993
26.313
+7.86
42.6%
jan 1, 1994
34.754
+8.442
32.08%
jan 1, 1995
39.736
+4.982
14.33%
jan 1, 1996
42.827
+3.091
7.78%
jan 1, 1997
42.462
-0.366
-0.85%
jan 1, 1998
38.061
-4.4
-10.36%
jan 1, 1999
43.433
+5.372
14.11%
jan 1, 2000
26.677
-16.756
-38.58%
jan 1, 2001
17.054
-9.623
-36.07%
jan 1, 2002
20.592
+3.538
20.75%
jan 1, 2003
24.475
+3.884
18.86%
jan 1, 2004
21.882
-2.593
-10.6%
jan 1, 2005
25.209
+3.327
15.2%
jan 1, 2006
21.859
-3.35
-13.29%
jan 1, 2007
15.619
-6.24
-28.55%
jan 1, 2008
14.153
-1.466
-9.38%
jan 1, 2009
12.515
-1.638
-11.57%
jan 1, 2010
9.991
-2.524
-20.17%
jan 1, 2011
16.64
+6.65
66.56%
jan 1, 2012
15.892
-0.748
-4.5%
jan 1, 2013
14.376
-1.516
-9.54%
jan 1, 2014
15.388
+1.012
7.04%
jan 1, 2015
18.027
+2.639
17.15%
jan 1, 2016
23.994
+5.967
33.1%
Ranking of countries by current statistics by years


Comments: