29
/
en
AIzaSyAYiBZKx7MnpbEhh9jyipgxe19OcubqV5w
April 1, 2024
166868
Kazakhstan
KAZ
true
2
1
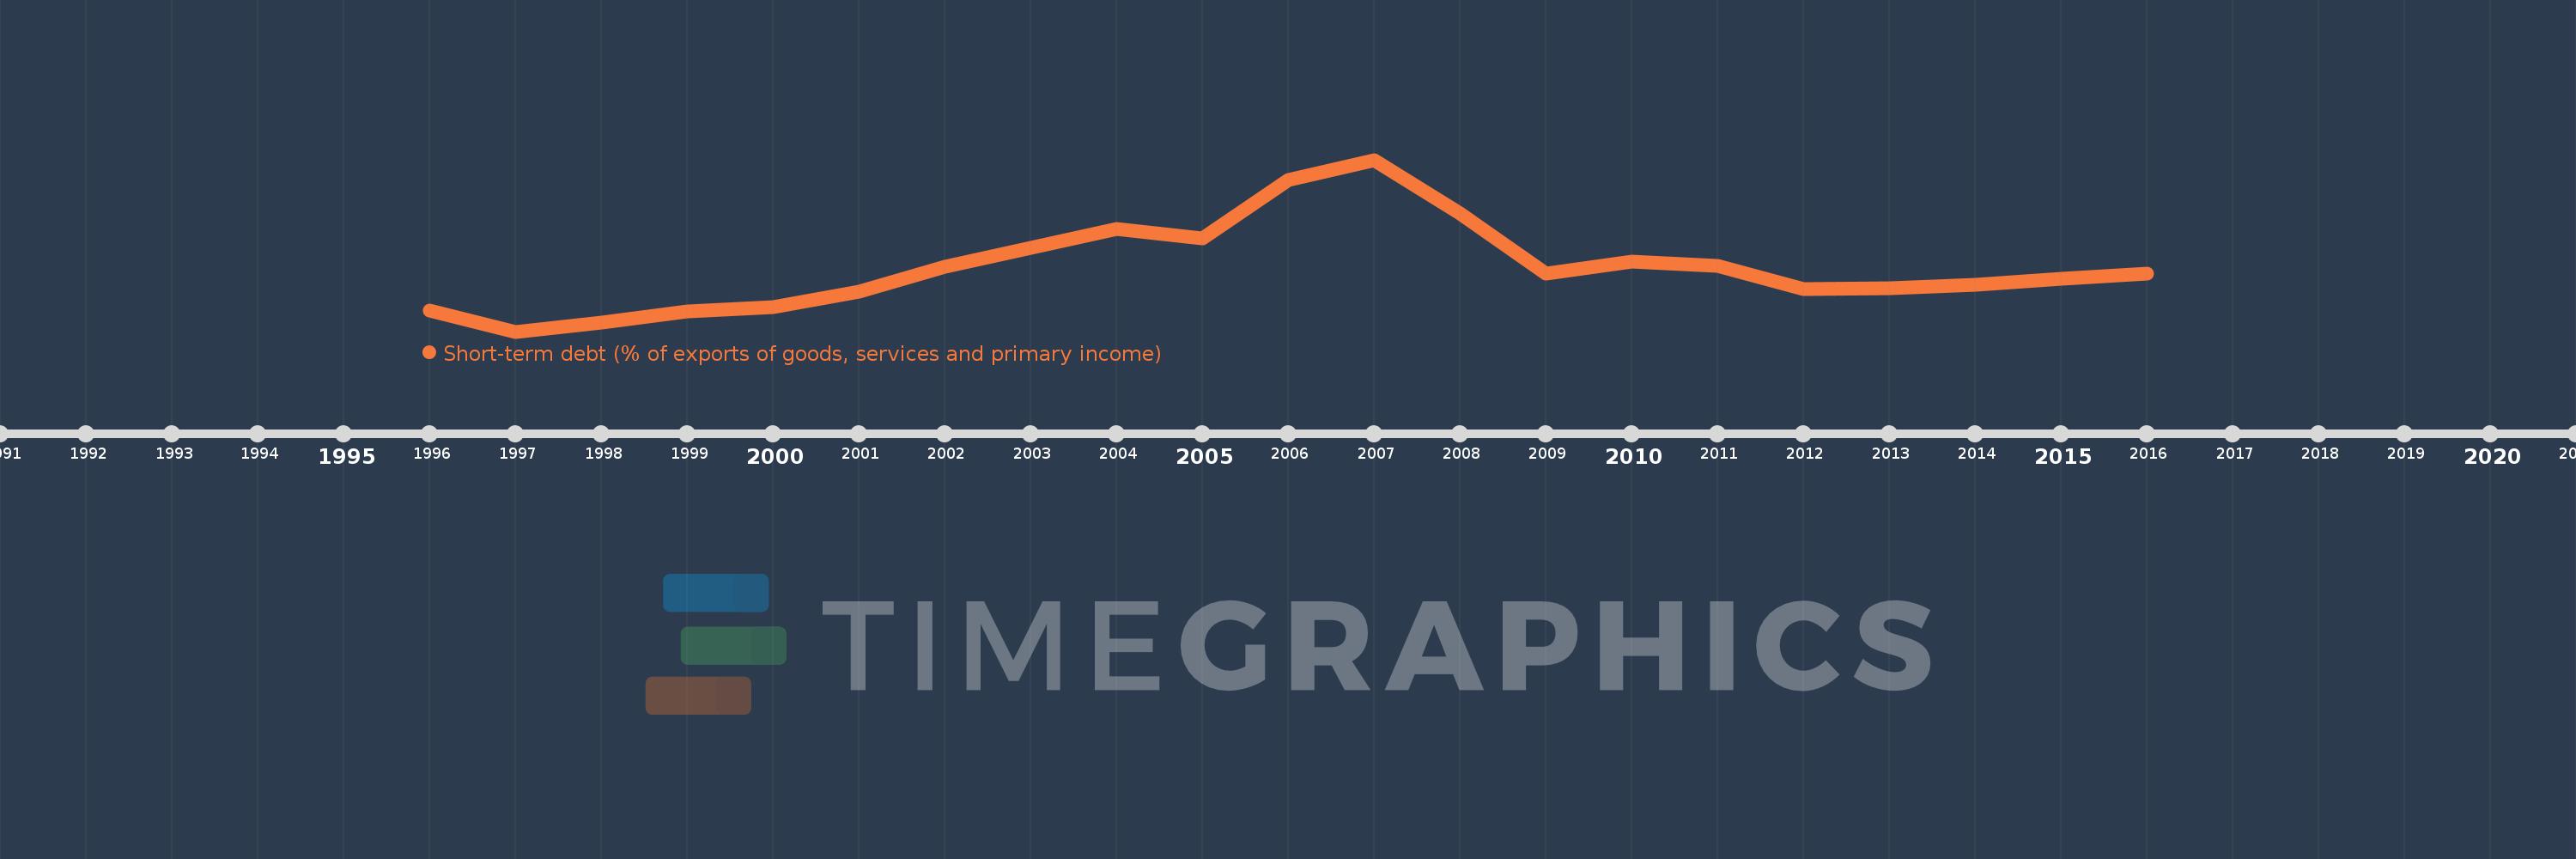
Short-term debt (% of exports of goods, services and primary income)
2016,2015,2014,2013,2012,2011,2010,2009,2008,2007,2006,2005,2004,2003,2002,2001,2000,1999,1998,1997,1996
This statistics in other country:
Timeline:
This timeline shows a graph from 1996 to 2016 of Kazakhstan. No data until 1995. Number of actual observations by date: 21.
Source name:
World Development Indicators
Source organization:
World Bank, International Debt Statistics.
Categories, topics:
Economy & Growth, External Debt
Last updated:
apr 23, 2017
Indicators value changes by year
Maximum:
28.799
jan 1, 2007
At the date of observation
Value
Absolute change
Change from previous value
jan 1, 1996
6.336
+6.336
0.0%
jan 1, 1997
3.15
-3.186
-50.28%
jan 1, 1998
4.466
+1.315
41.75%
jan 1, 1999
6.169
+1.703
38.14%
jan 1, 2000
6.744
+0.575
9.32%
jan 1, 2001
9.17
+2.426
35.97%
jan 1, 2002
12.881
+3.711
40.46%
jan 1, 2003
15.599
+2.718
21.1%
jan 1, 2004
18.485
+2.887
18.51%
jan 1, 2005
17.089
-1.397
-7.55%
jan 1, 2006
25.82
+8.732
51.1%
jan 1, 2007
28.799
+2.978
11.53%
jan 1, 2008
20.741
-8.057
-27.98%
jan 1, 2009
11.859
-8.882
-42.82%
jan 1, 2010
13.641
+1.783
15.03%
jan 1, 2011
12.996
-0.646
-4.74%
jan 1, 2012
9.541
-3.454
-26.58%
jan 1, 2013
9.682
+0.14
1.47%
jan 1, 2014
10.188
+0.506
5.23%
jan 1, 2015
10.995
+0.807
7.92%
jan 1, 2016
11.743
+0.747
6.8%
Ranking of countries by current statistics by years


Comments: