29
/
en
AIzaSyAYiBZKx7MnpbEhh9jyipgxe19OcubqV5w
April 1, 2024
193691
Mauritania
MRT
true
2
1
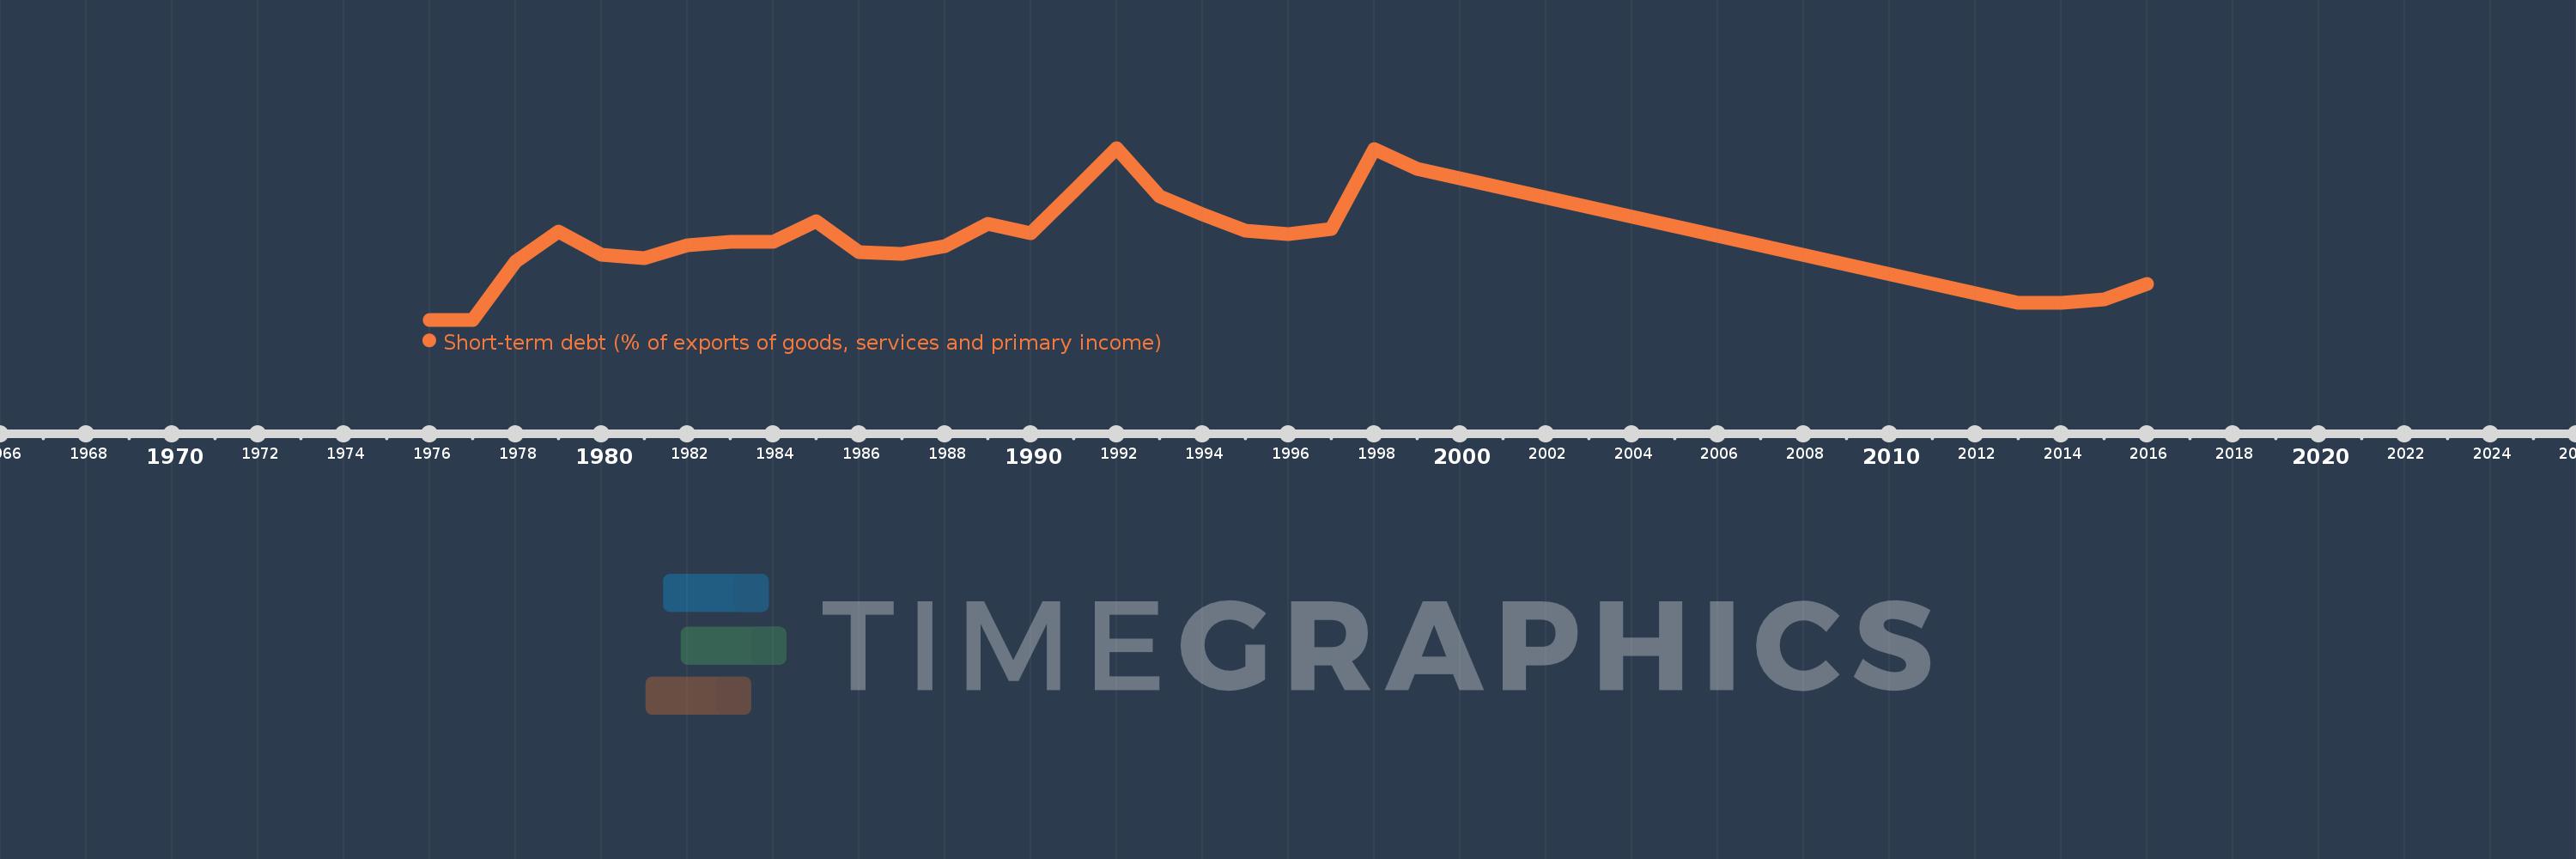
Short-term debt (% of exports of goods, services and primary income)
2016,2015,2014,2013,1999,1998,1997,1996,1995,1994,1993,1992,1991,1990,1989,1988,1987,1986,1985,1984,1983,1982,1981,1980,1979,1978,1977,1976
This statistics in other country:
Timeline:
This timeline shows a graph from 1976 to 2016 of Mauritania. No data until 1975. Number of actual observations by date: 28.
Source name:
World Development Indicators
Source organization:
World Bank, International Debt Statistics.
Categories, topics:
Economy & Growth, External Debt
Last updated:
apr 23, 2017
Indicators value changes by year
Maximum:
66.645
jan 1, 1992
At the date of observation
Value
Absolute change
Change from previous value
jan 1, 1976
0.102
+0.102
0.0%
jan 1, 1977
0.106
+0.003
2.98%
jan 1, 1978
22.679
+22.574
21.4K%
jan 1, 1979
34.404
+11.724
51.7%
jan 1, 1980
25.161
-9.243
-26.87%
jan 1, 1981
24.105
-1.056
-4.2%
jan 1, 1982
29.009
+4.905
20.35%
jan 1, 1983
30.4
+1.391
4.79%
jan 1, 1984
30.226
-0.174
-0.57%
jan 1, 1985
38.308
+8.082
26.74%
jan 1, 1986
26.209
-12.099
-31.58%
jan 1, 1987
25.583
-0.627
-2.39%
jan 1, 1988
28.716
+3.134
12.25%
jan 1, 1989
37.3
+8.584
29.89%
jan 1, 1990
33.699
-3.602
-9.66%
jan 1, 1991
50.071
+16.372
48.58%
jan 1, 1992
66.645
+16.575
33.1%
jan 1, 1993
47.957
-18.689
-28.04%
jan 1, 1994
40.941
-7.015
-14.63%
jan 1, 1995
34.662
-6.279
-15.34%
jan 1, 1996
33.415
-1.248
-3.6%
jan 1, 1997
35.139
+1.725
5.16%
jan 1, 1998
66.053
+30.913
87.97%
jan 1, 1999
58.624
-7.429
-11.25%
jan 1, 2013
6.739
-51.885
-88.5%
jan 1, 2014
6.797
+0.058
0.86%
jan 1, 2015
7.948
+1.151
16.93%
jan 1, 2016
14.045
+6.097
76.71%
Ranking of countries by current statistics by years


Comments: