29
/
en
AIzaSyAYiBZKx7MnpbEhh9jyipgxe19OcubqV5w
April 1, 2024
45681
Low & middle income
LMY
false
2
1
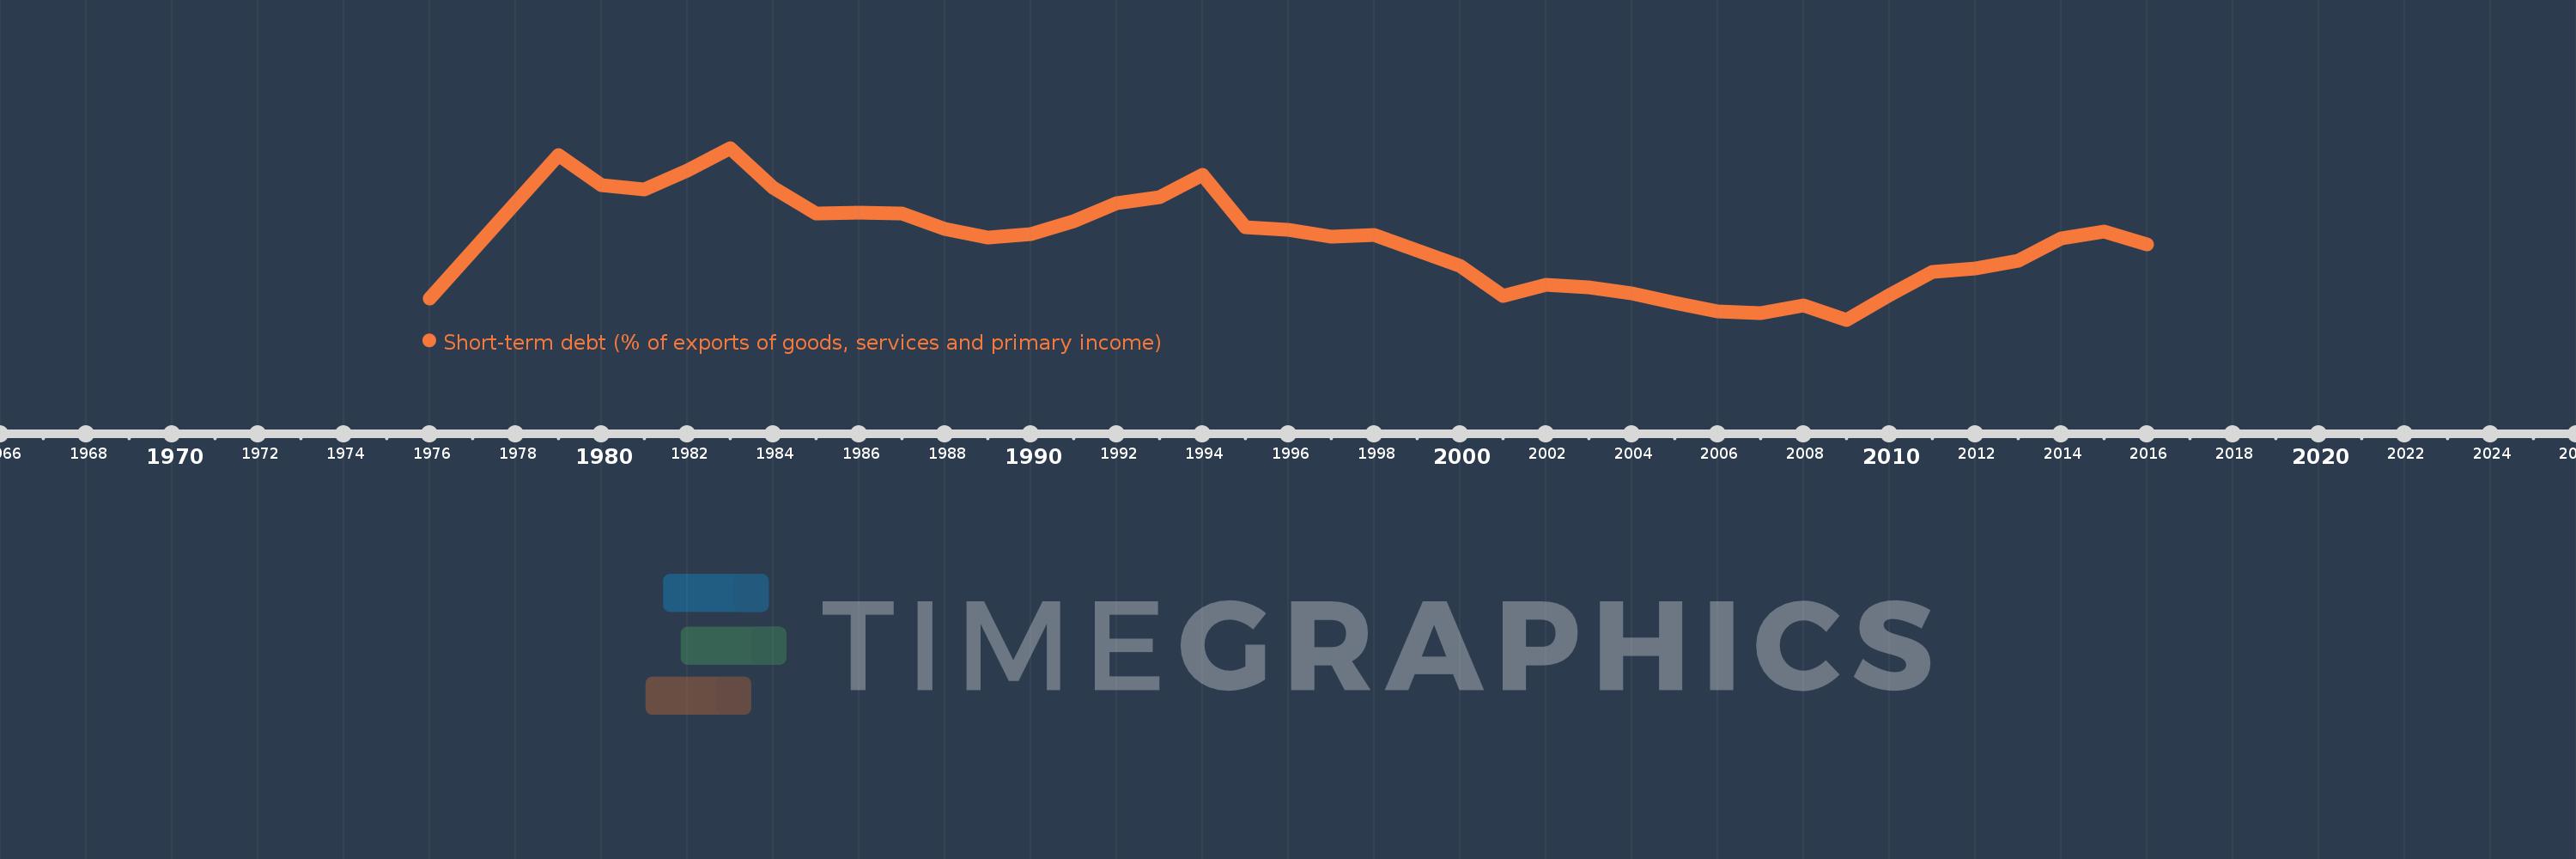
Short-term debt (% of exports of goods, services and primary income)
2016,2015,2014,2013,2012,2011,2010,2009,2008,2007,2006,2005,2004,2003,2002,2001,2000,1999,1998,1997,1996,1995,1994,1993,1992,1991,1990,1989,1988,1987,1986,1985,1984,1983,1982,1981,1980,1979,1976
This statistics in other country:
Timeline:
This timeline shows a graph from 1976 to 2016 of Low & middle income. No data until 1975. Number of actual observations by date: 39.
Source name:
World Development Indicators
Source organization:
World Bank, International Debt Statistics.
Categories, topics:
Economy & Growth, External Debt
Last updated:
apr 23, 2017
Indicators value changes by year
Minimum:
14.143
jan 1, 2009
Maximum:
44.325
jan 1, 1983
At the date of observation
Value
Absolute change
Change from previous value
jan 1, 1976
17.945
+17.945
0.0%
jan 1, 1979
43.072
+25.128
140.03%
jan 1, 1980
37.738
-5.334
-12.38%
jan 1, 1981
36.979
-0.759
-2.01%
jan 1, 1982
40.285
+3.306
8.94%
jan 1, 1983
44.325
+4.04
10.03%
jan 1, 1984
37.291
-7.034
-15.87%
jan 1, 1985
32.837
-4.454
-11.94%
jan 1, 1986
32.965
+0.128
0.39%
jan 1, 1987
32.798
-0.167
-0.51%
jan 1, 1988
30.095
-2.703
-8.24%
jan 1, 1989
28.539
-1.556
-5.17%
jan 1, 1990
29.148
+0.609
2.13%
jan 1, 1991
31.447
+2.299
7.89%
jan 1, 1992
34.625
+3.179
10.11%
jan 1, 1993
35.627
+1.001
2.89%
jan 1, 1994
39.613
+3.986
11.19%
jan 1, 1995
30.349
-9.263
-23.38%
jan 1, 1996
29.949
-0.4
-1.32%
jan 1, 1997
28.694
-1.255
-4.19%
jan 1, 1998
28.997
+0.303
1.06%
jan 1, 1999
26.256
-2.741
-9.45%
jan 1, 2000
23.625
-2.631
-10.02%
jan 1, 2001
18.272
-5.353
-22.66%
jan 1, 2002
20.327
+2.055
11.25%
jan 1, 2003
19.895
-0.432
-2.12%
jan 1, 2004
18.838
-1.057
-5.31%
jan 1, 2005
17.115
-1.723
-9.15%
jan 1, 2006
15.6
-1.516
-8.85%
jan 1, 2007
15.231
-0.368
-2.36%
jan 1, 2008
16.737
+1.506
9.89%
jan 1, 2009
14.143
-2.595
-15.5%
jan 1, 2010
18.539
+4.397
31.09%
jan 1, 2011
22.506
+3.967
21.4%
jan 1, 2012
23.157
+0.651
2.89%
jan 1, 2013
24.51
+1.352
5.84%
jan 1, 2014
28.503
+3.994
16.29%
jan 1, 2015
29.631
+1.127
3.95%
jan 1, 2016
27.321
-2.309
-7.79%
Ranking of countries by current statistics by years


Comments: