29
/
en
AIzaSyAYiBZKx7MnpbEhh9jyipgxe19OcubqV5w
April 1, 2024
124224
Ecuador
ECU
true
2
1
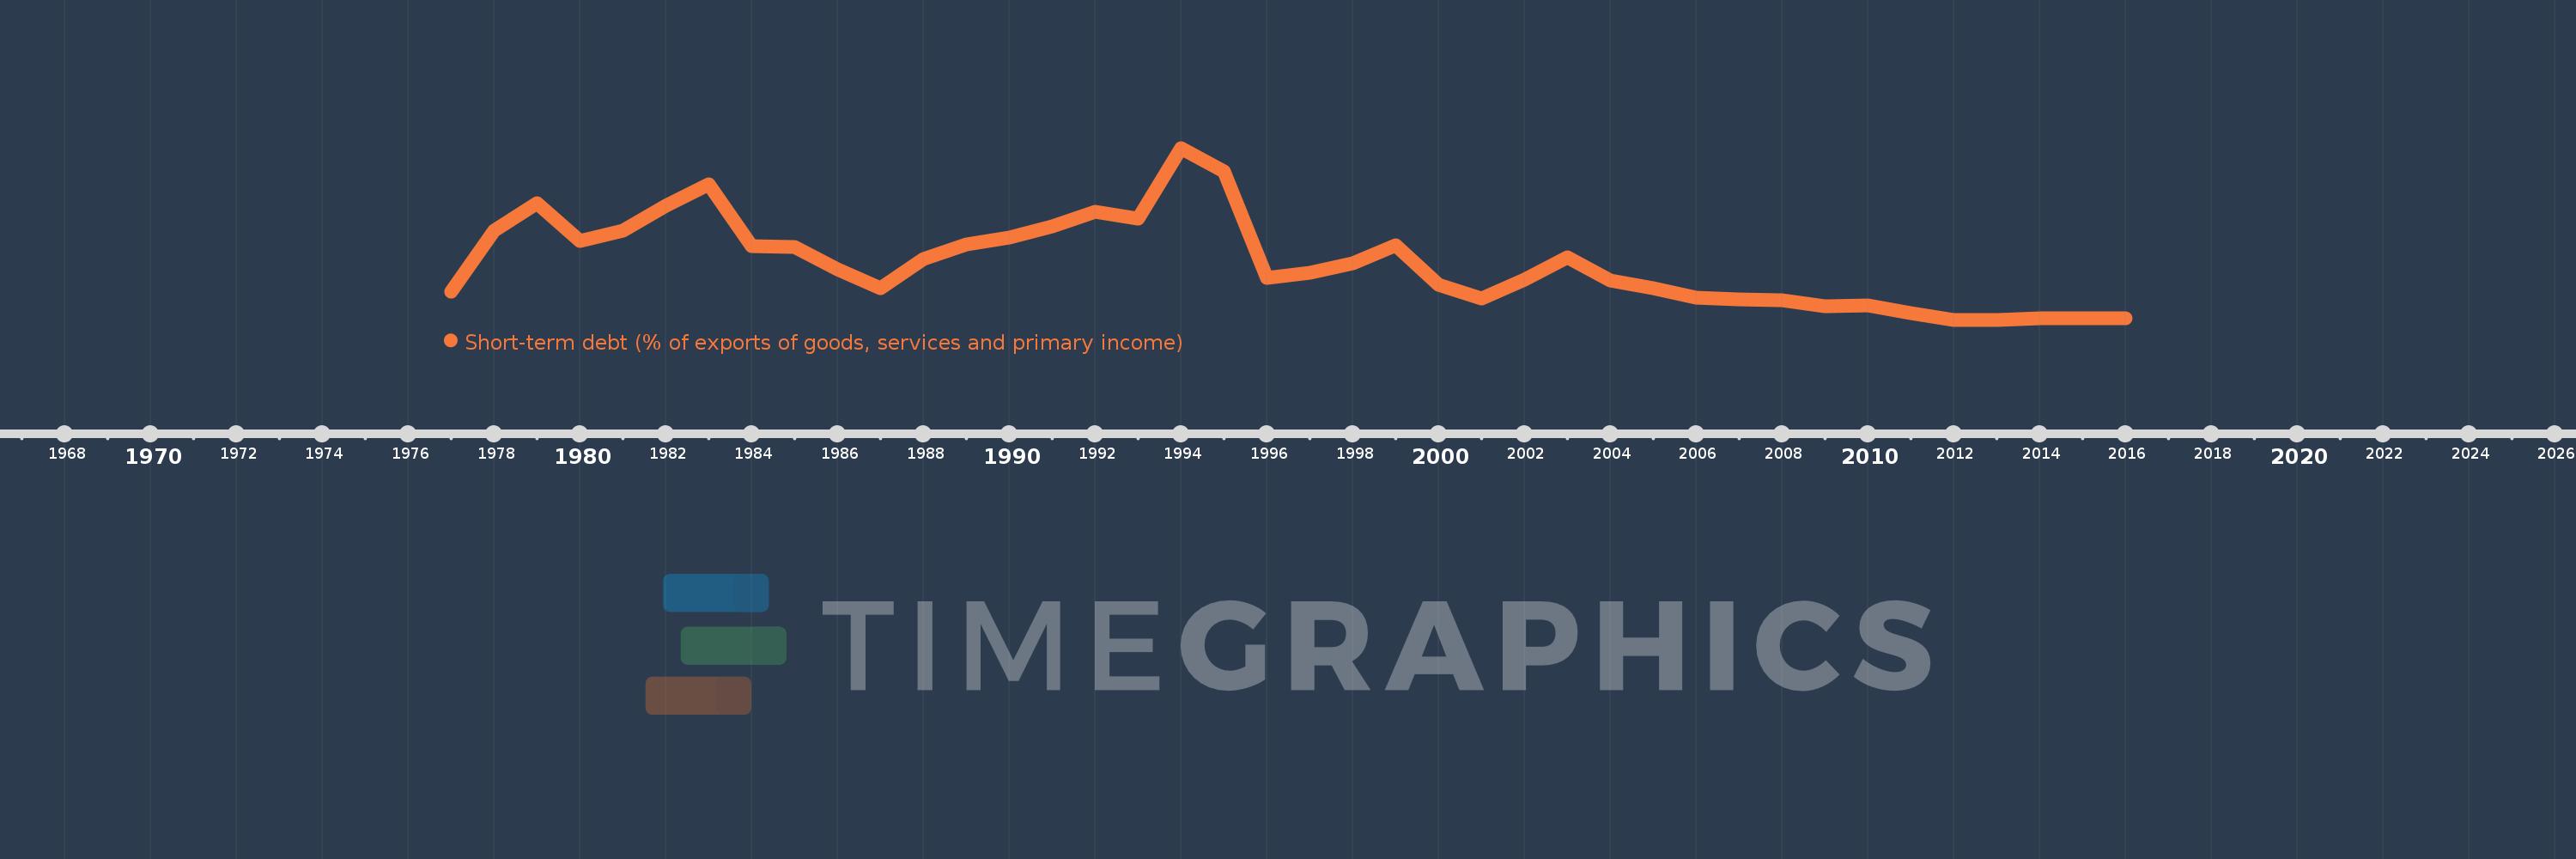
Short-term debt (% of exports of goods, services and primary income)
2016,2015,2014,2013,2012,2011,2010,2009,2008,2007,2006,2005,2004,2003,2002,2001,2000,1999,1998,1997,1996,1995,1994,1993,1992,1991,1990,1989,1988,1987,1986,1985,1984,1983,1982,1981,1980,1979,1978,1977
This statistics in other country:
Timeline:
This timeline shows a graph from 1977 to 2016 of Ecuador. No data until 1976. Number of actual observations by date: 40.
Source name:
World Development Indicators
Source organization:
World Bank, International Debt Statistics.
Categories, topics:
Economy & Growth, External Debt
Last updated:
apr 23, 2017
Indicators value changes by year
Maximum:
101.59
jan 1, 1994
At the date of observation
Value
Absolute change
Change from previous value
jan 1, 1977
16.762
+16.762
0.0%
jan 1, 1978
52.638
+35.876
214.03%
jan 1, 1979
68.914
+16.276
30.92%
jan 1, 1980
46.464
-22.45
-32.58%
jan 1, 1981
52.942
+6.479
13.94%
jan 1, 1982
67.482
+14.539
27.46%
jan 1, 1983
80.143
+12.662
18.76%
jan 1, 1984
43.41
-36.733
-45.83%
jan 1, 1985
43.254
-0.156
-0.36%
jan 1, 1986
29.7
-13.554
-31.34%
jan 1, 1987
18.827
-10.873
-36.61%
jan 1, 1988
36.219
+17.392
92.38%
jan 1, 1989
44.83
+8.611
23.77%
jan 1, 1990
48.693
+3.864
8.62%
jan 1, 1991
55.187
+6.493
13.34%
jan 1, 1992
63.765
+8.579
15.54%
jan 1, 1993
59.912
-3.853
-6.04%
jan 1, 1994
101.59
+41.678
69.56%
jan 1, 1995
87.745
-13.845
-13.63%
jan 1, 1996
24.782
-62.964
-71.76%
jan 1, 1997
27.865
+3.084
12.44%
jan 1, 1998
33.504
+5.639
20.23%
jan 1, 1999
44.331
+10.827
32.32%
jan 1, 2000
20.857
-23.474
-52.95%
jan 1, 2001
12.932
-7.924
-37.99%
jan 1, 2002
23.719
+10.787
83.41%
jan 1, 2003
37.184
+13.465
56.77%
jan 1, 2004
23.203
-13.981
-37.6%
jan 1, 2005
18.984
-4.219
-18.18%
jan 1, 2006
13.002
-5.982
-31.51%
jan 1, 2007
12.222
-0.78
-6.0%
jan 1, 2008
11.546
-0.676
-5.53%
jan 1, 2009
8.228
-3.318
-28.74%
jan 1, 2010
8.752
+0.524
6.37%
jan 1, 2011
4.055
-4.697
-53.66%
jan 1, 2012
0.201
-3.854
-95.05%
jan 1, 2013
0.182
-0.019
-9.38%
jan 1, 2014
1.033
+0.851
467.92%
jan 1, 2015
0.995
-0.038
-3.72%
jan 1, 2016
1.274
+0.279
28.09%
Ranking of countries by current statistics by years


Comments: