29
/
en
AIzaSyAYiBZKx7MnpbEhh9jyipgxe19OcubqV5w
April 1, 2024
50471
Middle East & North Africa (IDA & IBRD countries)
TMN
false
2
1
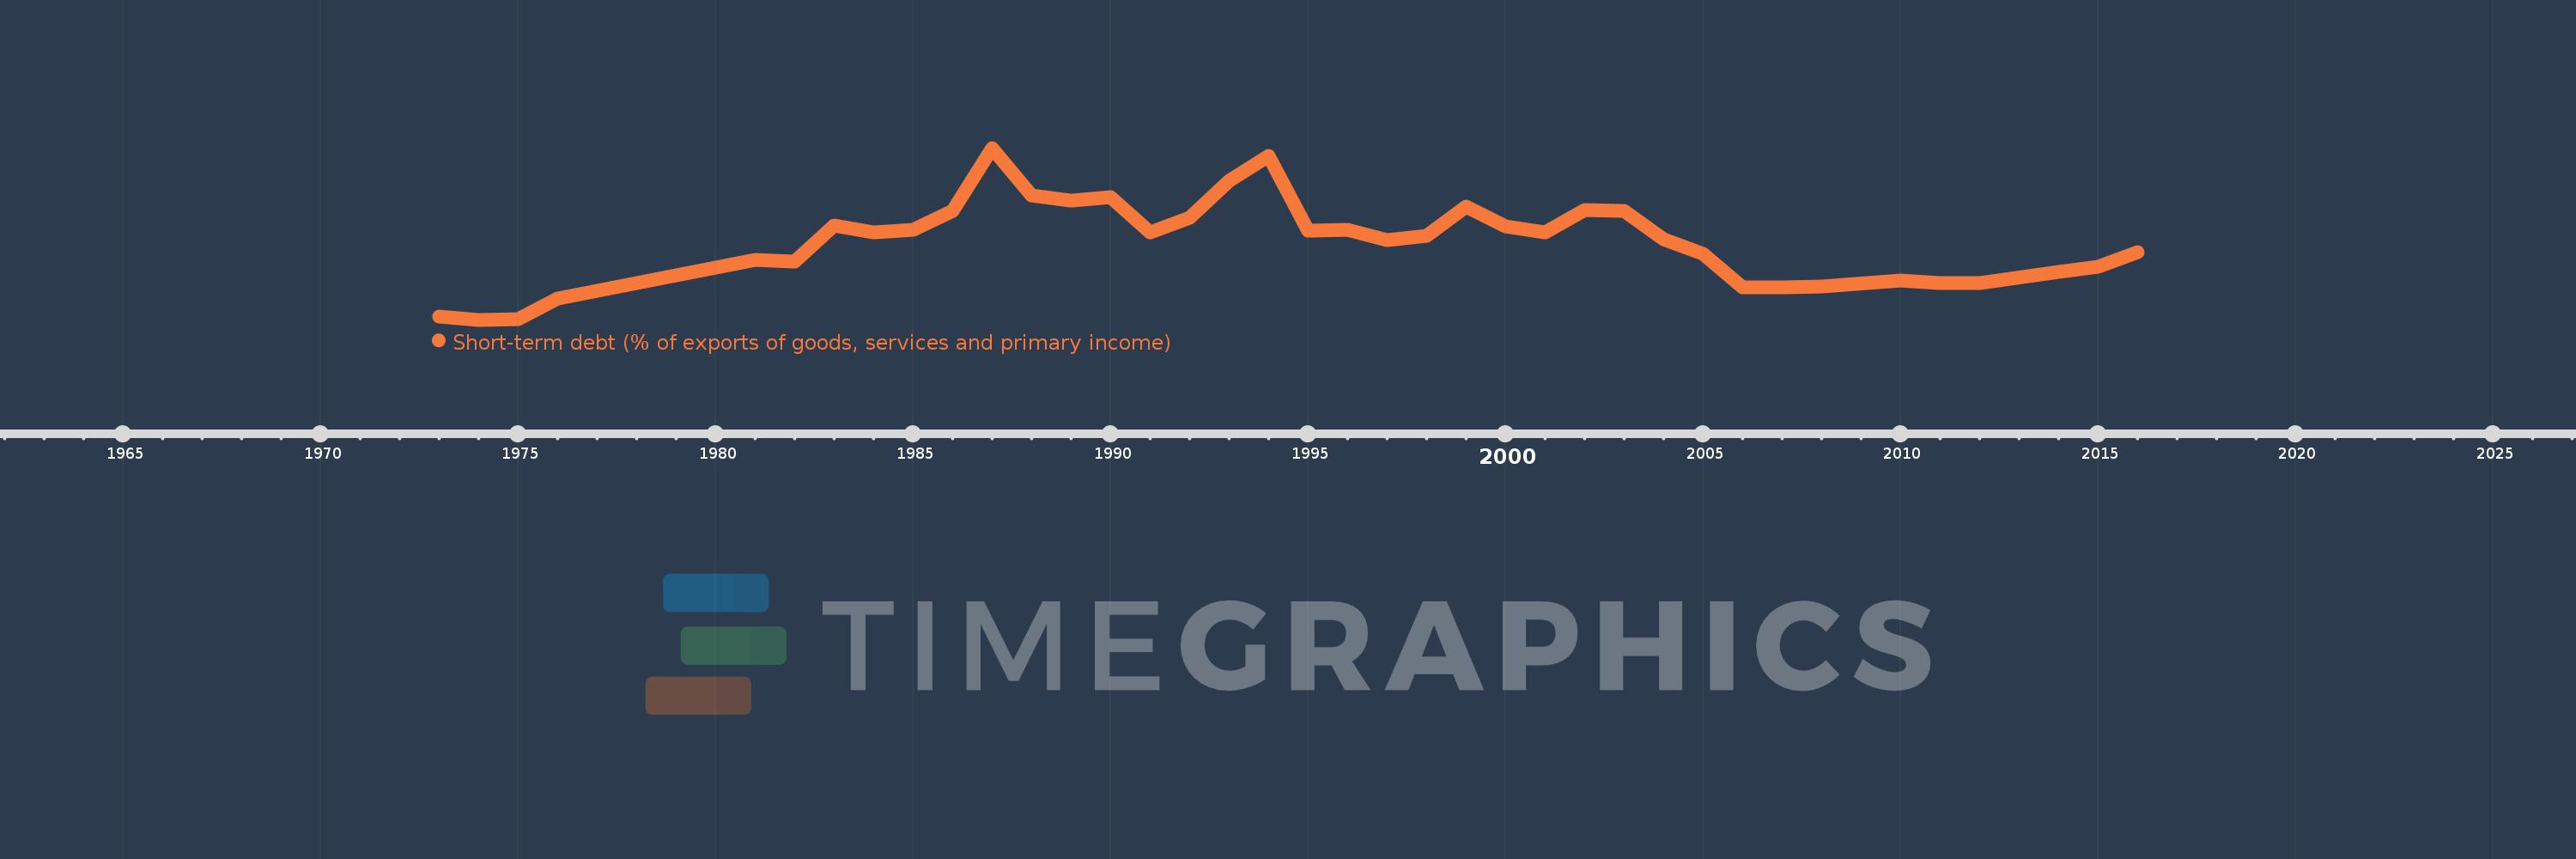
Short-term debt (% of exports of goods, services and primary income)
2016,2015,2014,2012,2011,2010,2008,2007,2006,2005,2004,2003,2002,2001,2000,1999,1998,1997,1996,1995,1994,1993,1992,1991,1990,1989,1988,1987,1986,1985,1984,1983,1982,1981,1976,1975,1974,1973
This statistics in other country:
Timeline:
This timeline shows a graph from 1973 to 2016 of Middle East & North Africa (IDA & IBRD countries). No data until 1972. Number of actual observations by date: 38.
Source name:
World Development Indicators
Source organization:
World Bank, International Debt Statistics.
Categories, topics:
Economy & Growth, External Debt
Last updated:
apr 23, 2017
Indicators value changes by year
Maximum:
51.008
jan 1, 1987
At the date of observation
Value
Absolute change
Change from previous value
jan 1, 1973
1.436
+1.436
0.0%
jan 1, 1974
0.385
-1.051
-73.17%
jan 1, 1975
0.513
+0.128
33.27%
jan 1, 1976
6.723
+6.21
1.21K%
jan 1, 1981
17.964
+11.24
167.19%
jan 1, 1982
17.571
-0.392
-2.18%
jan 1, 1983
28.251
+10.679
60.78%
jan 1, 1984
26.06
-2.19
-7.75%
jan 1, 1985
26.794
+0.734
2.82%
jan 1, 1986
32.44
+5.646
21.07%
jan 1, 1987
51.008
+18.568
57.24%
jan 1, 1988
37.059
-13.949
-27.35%
jan 1, 1989
35.563
-1.496
-4.04%
jan 1, 1990
36.486
+0.923
2.59%
jan 1, 1991
26.221
-10.265
-28.13%
jan 1, 1992
30.521
+4.299
16.4%
jan 1, 1993
41.216
+10.695
35.04%
jan 1, 1994
48.637
+7.421
18.0%
jan 1, 1995
26.704
-21.933
-45.1%
jan 1, 1996
26.775
+0.071
0.27%
jan 1, 1997
23.737
-3.038
-11.35%
jan 1, 1998
25.016
+1.279
5.39%
jan 1, 1999
33.608
+8.593
34.35%
jan 1, 2000
27.9
-5.708
-16.99%
jan 1, 2001
26.097
-1.803
-6.46%
jan 1, 2002
32.782
+6.685
25.62%
jan 1, 2003
32.501
-0.281
-0.86%
jan 1, 2004
24.141
-8.36
-25.72%
jan 1, 2005
19.921
-4.22
-17.48%
jan 1, 2006
9.924
-9.997
-50.18%
jan 1, 2007
9.898
-0.027
-0.27%
jan 1, 2008
10.147
+0.25
2.52%
jan 1, 2010
11.861
+1.714
16.89%
jan 1, 2011
11.313
-0.549
-4.63%
jan 1, 2012
11.083
-0.23
-2.03%
jan 1, 2014
14.428
+3.345
30.18%
jan 1, 2015
16.11
+1.682
11.66%
jan 1, 2016
20.34
+4.23
26.26%
Ranking of countries by current statistics by years


Comments: