29
/
en
AIzaSyAYiBZKx7MnpbEhh9jyipgxe19OcubqV5w
April 1, 2024
41082
Late-demographic dividend
LTE
false
2
1
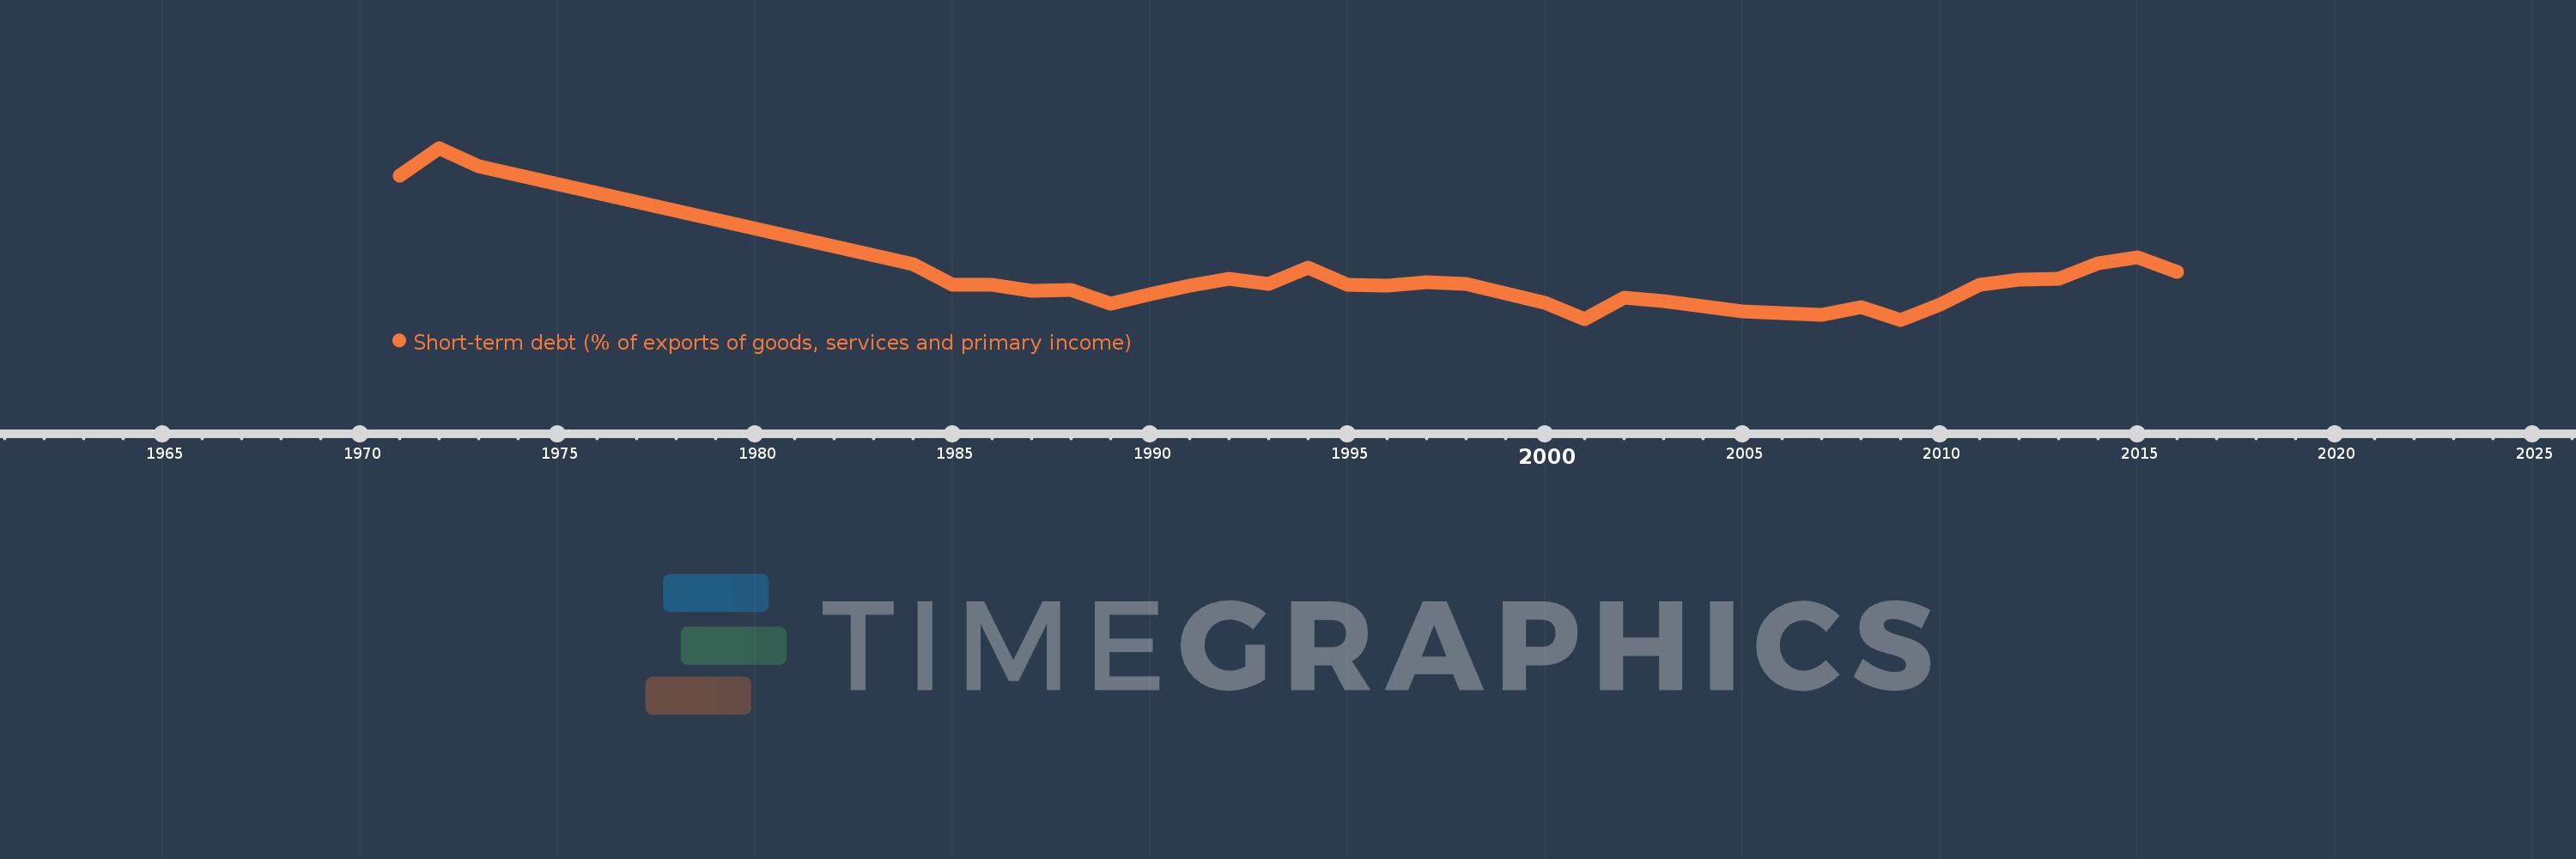
Short-term debt (% of exports of goods, services and primary income)
2016,2015,2014,2013,2012,2011,2010,2009,2008,2007,2006,2005,2004,2003,2002,2001,2000,1999,1998,1997,1996,1995,1994,1993,1992,1991,1990,1989,1988,1987,1986,1985,1984,1973,1972,1971
This statistics in other country:
Timeline:
This timeline shows a graph from 1971 to 2016 of Late-demographic dividend. No data until 1970. Number of actual observations by date: 36.
Source name:
World Development Indicators
Source organization:
World Bank, International Debt Statistics.
Categories, topics:
Economy & Growth, External Debt
Last updated:
apr 23, 2017
Indicators value changes by year
Minimum:
12.914
jan 1, 2009
Maximum:
67.911
jan 1, 1972
At the date of observation
Value
Absolute change
Change from previous value
jan 1, 1971
59.078
+59.078
0.0%
jan 1, 1972
67.911
+8.834
14.95%
jan 1, 1973
61.957
-5.955
-8.77%
jan 1, 1984
30.584
-31.373
-50.64%
jan 1, 1985
24.174
-6.41
-20.96%
jan 1, 1986
24.164
-0.009
-0.04%
jan 1, 1987
22.098
-2.066
-8.55%
jan 1, 1988
22.536
+0.438
1.98%
jan 1, 1989
18.069
-4.467
-19.82%
jan 1, 1990
20.955
+2.886
15.97%
jan 1, 1991
23.952
+2.998
14.3%
jan 1, 1992
25.951
+1.999
8.35%
jan 1, 1993
24.481
-1.47
-5.66%
jan 1, 1994
29.573
+5.092
20.8%
jan 1, 1995
24.078
-5.495
-18.58%
jan 1, 1996
23.711
-0.367
-1.52%
jan 1, 1997
24.954
+1.243
5.24%
jan 1, 1998
24.498
-0.457
-1.83%
jan 1, 1999
21.244
-3.253
-13.28%
jan 1, 2000
18.295
-2.949
-13.88%
jan 1, 2001
13.24
-5.055
-27.63%
jan 1, 2002
19.86
+6.62
50.0%
jan 1, 2003
18.903
-0.957
-4.82%
jan 1, 2004
17.245
-1.658
-8.77%
jan 1, 2005
15.689
-1.556
-9.02%
jan 1, 2006
15.125
-0.564
-3.59%
jan 1, 2007
14.482
-0.643
-4.25%
jan 1, 2008
16.872
+2.39
16.5%
jan 1, 2009
12.914
-3.959
-23.46%
jan 1, 2010
17.678
+4.765
36.9%
jan 1, 2011
23.982
+6.304
35.66%
jan 1, 2012
25.791
+1.809
7.54%
jan 1, 2013
26.146
+0.355
1.38%
jan 1, 2014
30.879
+4.733
18.1%
jan 1, 2015
32.895
+2.016
6.53%
jan 1, 2016
28.115
-4.779
-14.53%
Ranking of countries by current statistics by years


Comments: