29
/
en
AIzaSyAYiBZKx7MnpbEhh9jyipgxe19OcubqV5w
April 1, 2024
268719
Tunisia
TUN
true
2
1
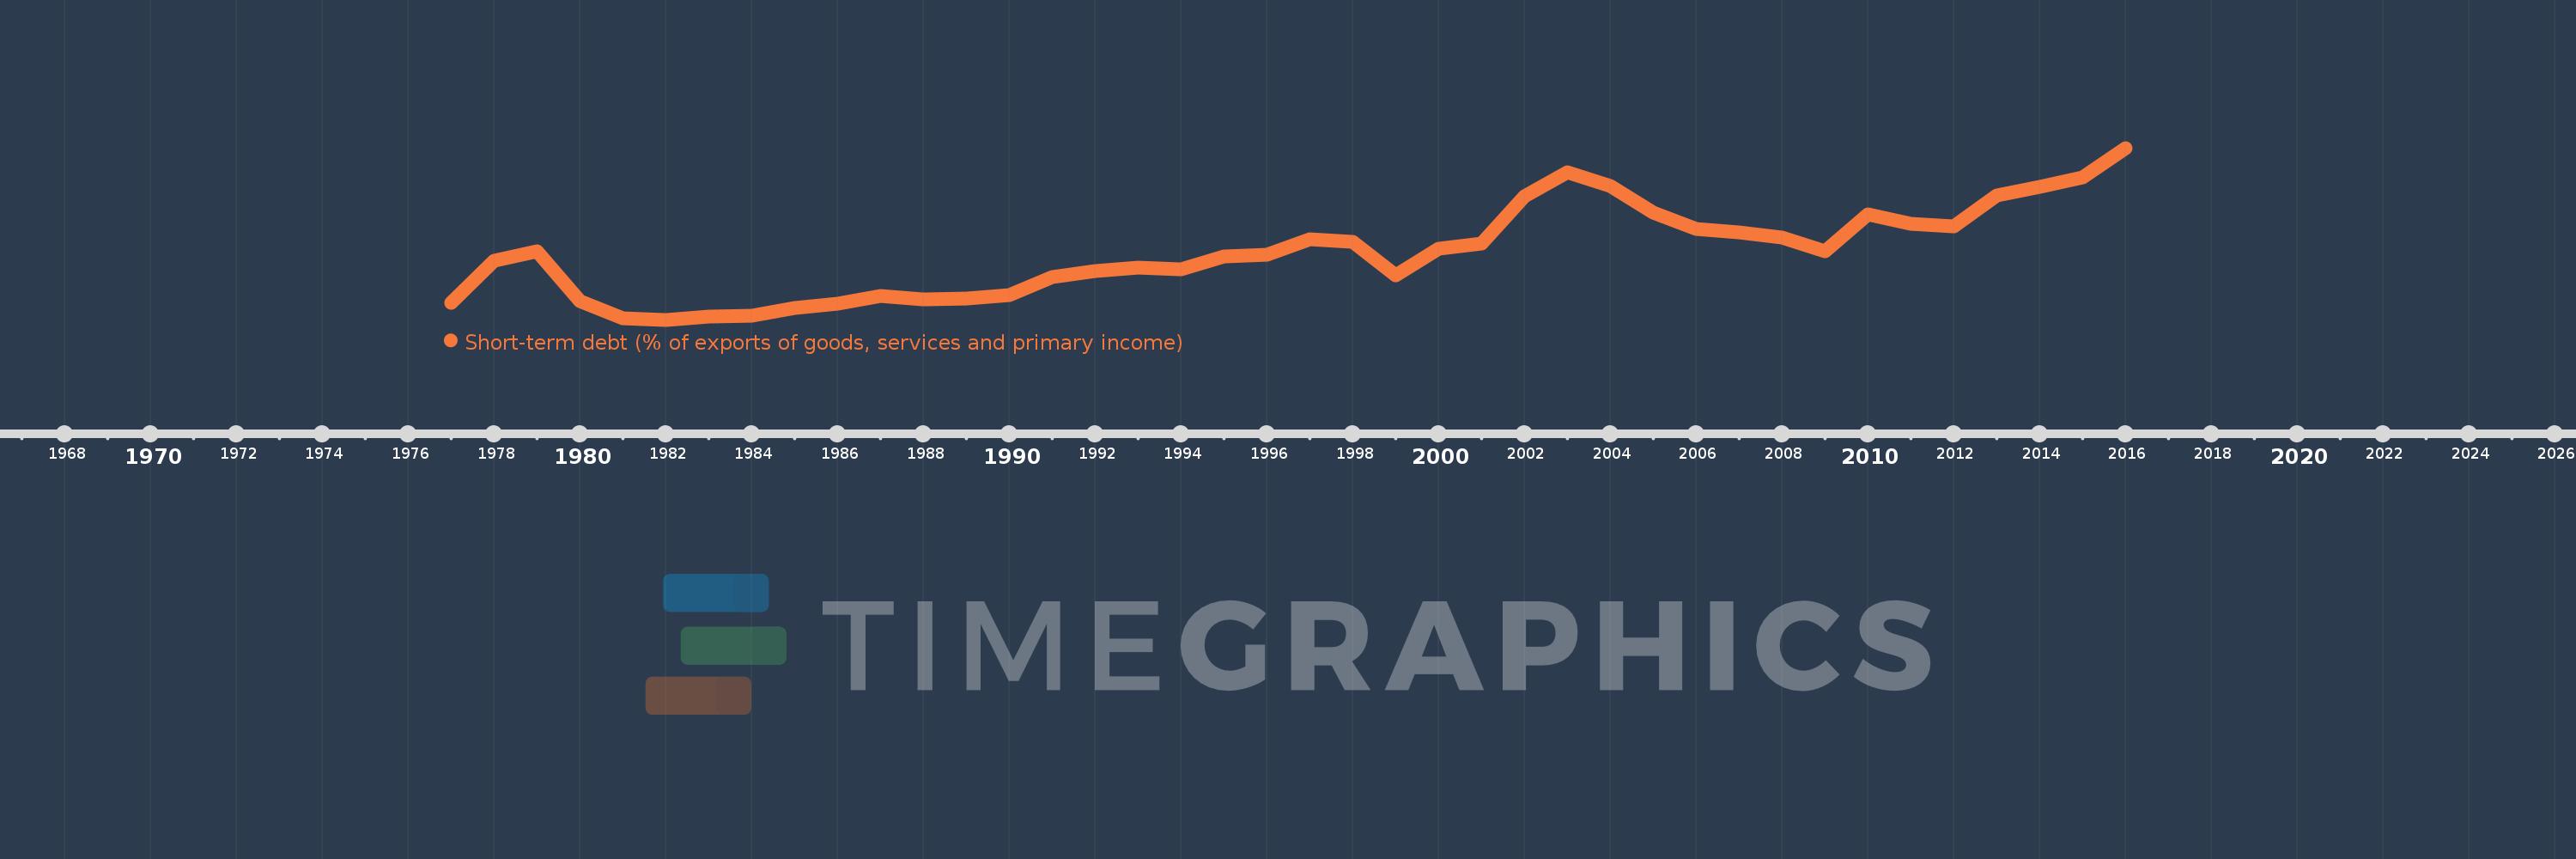
Short-term debt (% of exports of goods, services and primary income)
2016,2015,2014,2013,2012,2011,2010,2009,2008,2007,2006,2005,2004,2003,2002,2001,2000,1999,1998,1997,1996,1995,1994,1993,1992,1991,1990,1989,1988,1987,1986,1985,1984,1983,1982,1981,1980,1979,1978,1977
This statistics in other country:
Timeline:
This timeline shows a graph from 1977 to 2016 of Tunisia. No data until 1976. Number of actual observations by date: 40.
Source name:
World Development Indicators
Source organization:
World Bank, International Debt Statistics.
Categories, topics:
Economy & Growth, External Debt
Last updated:
apr 23, 2017
Indicators value changes by year
Maximum:
36.669
jan 1, 2016
At the date of observation
Value
Absolute change
Change from previous value
jan 1, 1977
6.996
+6.996
0.0%
jan 1, 1978
14.973
+7.976
114.01%
jan 1, 1979
16.811
+1.838
12.28%
jan 1, 1980
7.286
-9.525
-56.66%
jan 1, 1981
4.062
-3.224
-44.25%
jan 1, 1982
3.724
-0.338
-8.31%
jan 1, 1983
4.388
+0.663
17.8%
jan 1, 1984
4.449
+0.062
1.41%
jan 1, 1985
6.054
+1.605
36.07%
jan 1, 1986
6.759
+0.705
11.64%
jan 1, 1987
8.336
+1.577
23.33%
jan 1, 1988
7.58
-0.756
-9.07%
jan 1, 1989
7.78
+0.2
2.64%
jan 1, 1990
8.449
+0.669
8.6%
jan 1, 1991
11.968
+3.519
41.64%
jan 1, 1992
12.983
+1.015
8.48%
jan 1, 1993
13.783
+0.8
6.16%
jan 1, 1994
13.468
-0.315
-2.28%
jan 1, 1995
15.847
+2.379
17.66%
jan 1, 1996
16.176
+0.33
2.08%
jan 1, 1997
19.181
+3.005
18.57%
jan 1, 1998
18.656
-0.525
-2.74%
jan 1, 1999
12.219
-6.437
-34.5%
jan 1, 2000
17.423
+5.204
42.59%
jan 1, 2001
18.376
+0.953
5.47%
jan 1, 2002
27.362
+8.986
48.9%
jan 1, 2003
31.949
+4.587
16.77%
jan 1, 2004
29.371
-2.578
-8.07%
jan 1, 2005
24.275
-5.096
-17.35%
jan 1, 2006
21.063
-3.212
-13.23%
jan 1, 2007
20.517
-0.546
-2.59%
jan 1, 2008
19.415
-1.103
-5.37%
jan 1, 2009
16.914
-2.501
-12.88%
jan 1, 2010
24.017
+7.103
42.0%
jan 1, 2011
22.074
-1.943
-8.09%
jan 1, 2012
21.566
-0.508
-2.3%
jan 1, 2013
27.564
+5.998
27.81%
jan 1, 2014
29.191
+1.627
5.9%
jan 1, 2015
30.972
+1.781
6.1%
jan 1, 2016
36.669
+5.696
18.39%
Ranking of countries by current statistics by years


Comments: