29
/
en
AIzaSyAYiBZKx7MnpbEhh9jyipgxe19OcubqV5w
April 1, 2024
274312
Ukraine
UKR
true
2
1
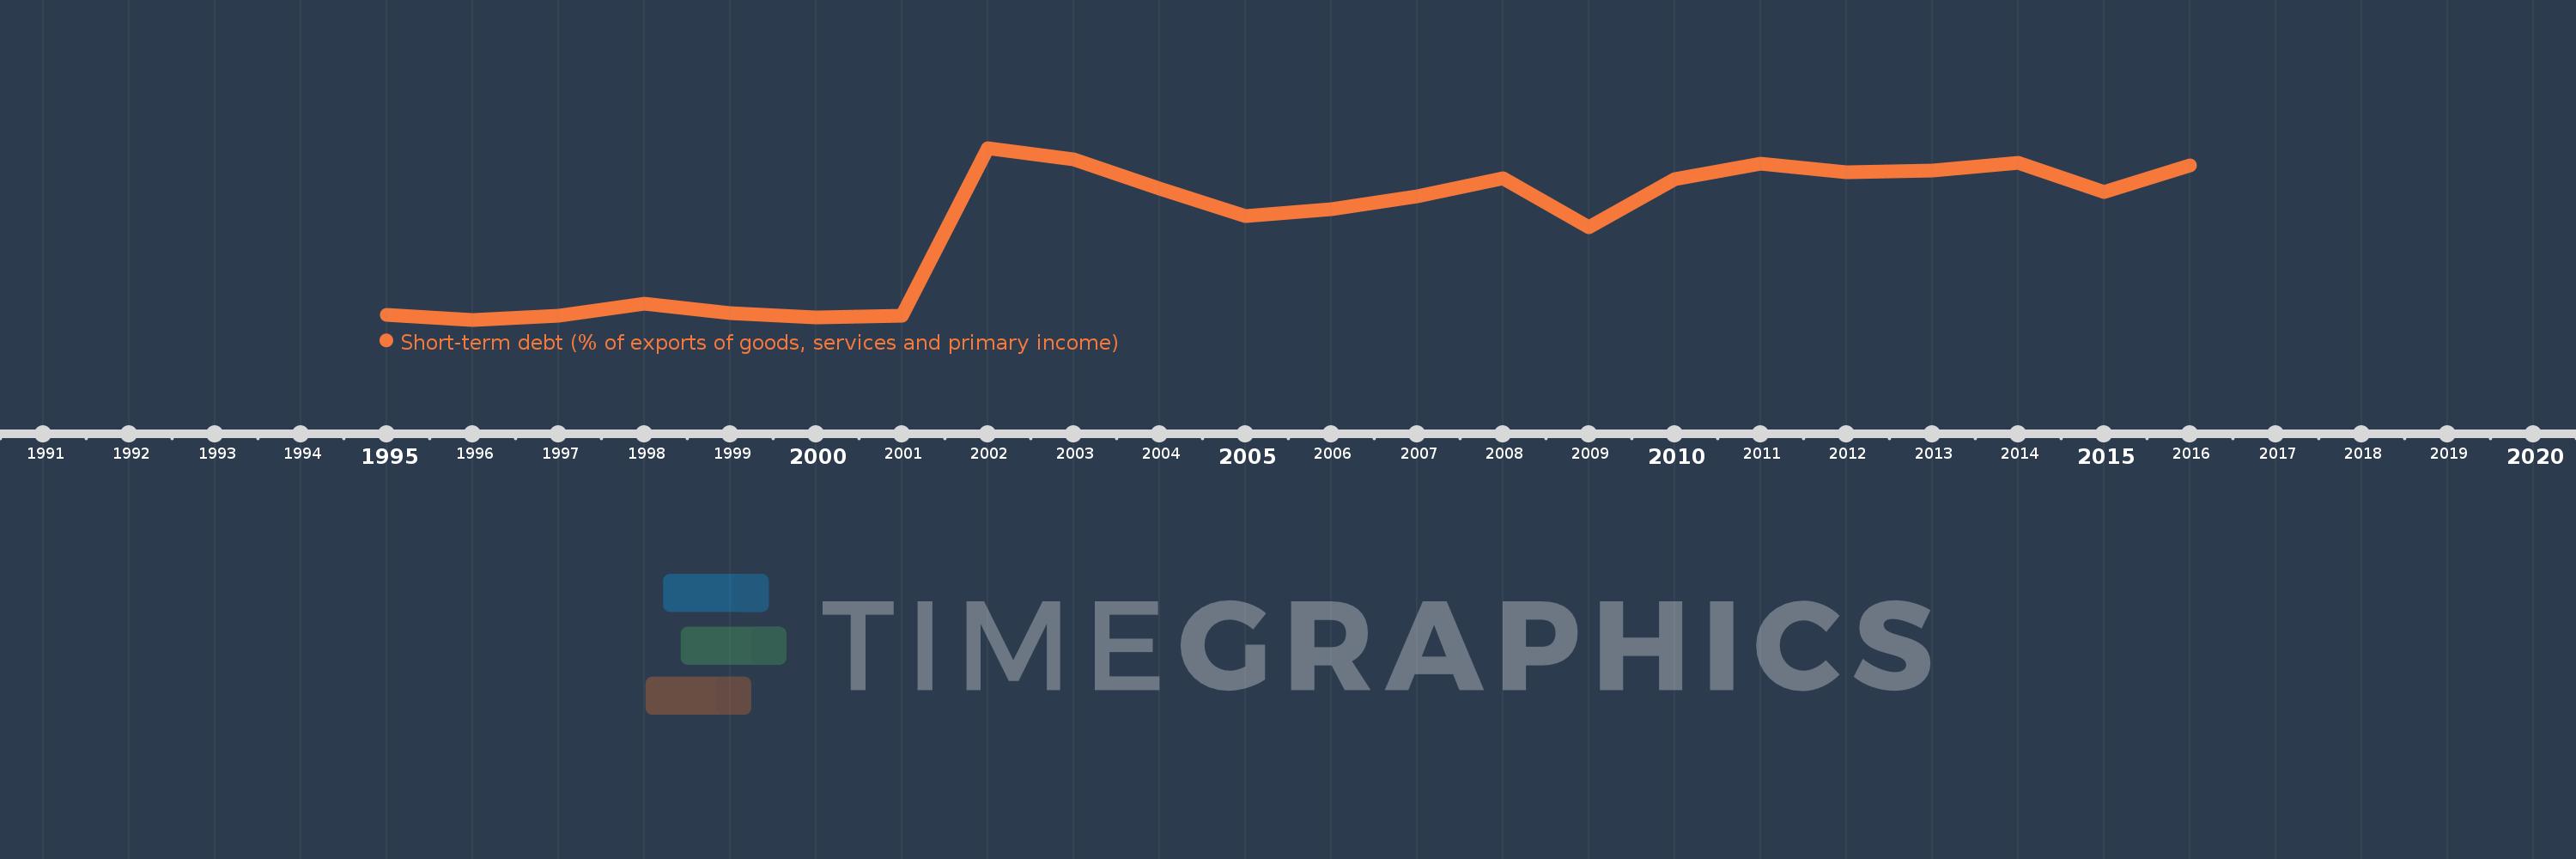
Short-term debt (% of exports of goods, services and primary income)
2016,2015,2014,2013,2012,2011,2010,2009,2008,2007,2006,2005,2004,2003,2002,2001,2000,1999,1998,1997,1996,1995
This statistics in other country:
Timeline:
This timeline shows a graph from 1995 to 2016 of Ukraine. No data until 1994. Number of actual observations by date: 22.
Source name:
World Development Indicators
Source organization:
World Bank, International Debt Statistics.
Categories, topics:
Economy & Growth, External Debt
Last updated:
apr 23, 2017
Indicators value changes by year
At the date of observation
Value
Absolute change
Change from previous value
jan 1, 1995
2.592
+2.592
0.0%
jan 1, 1996
1.371
-1.221
-47.1%
jan 1, 1997
2.357
+0.986
71.91%
jan 1, 1998
5.309
+2.952
125.24%
jan 1, 1999
2.868
-2.441
-45.97%
jan 1, 2000
1.951
-0.917
-31.99%
jan 1, 2001
2.399
+0.448
22.96%
jan 1, 2002
42.44
+40.041
1.67K%
jan 1, 2003
39.731
-2.709
-6.38%
jan 1, 2004
32.696
-7.034
-17.71%
jan 1, 2005
26.2
-6.497
-19.87%
jan 1, 2006
27.805
+1.606
6.13%
jan 1, 2007
30.915
+3.109
11.18%
jan 1, 2008
35.215
+4.3
13.91%
jan 1, 2009
23.477
-11.738
-33.33%
jan 1, 2010
35.048
+11.571
49.29%
jan 1, 2011
38.759
+3.712
10.59%
jan 1, 2012
36.715
-2.045
-5.28%
jan 1, 2013
37.127
+0.412
1.12%
jan 1, 2014
38.915
+1.787
4.81%
jan 1, 2015
31.984
-6.93
-17.81%
jan 1, 2016
38.225
+6.241
19.51%
Ranking of countries by current statistics by years


Comments: