29
/
en
AIzaSyAYiBZKx7MnpbEhh9jyipgxe19OcubqV5w
April 1, 2024
246317
South Africa
ZAF
true
2
1
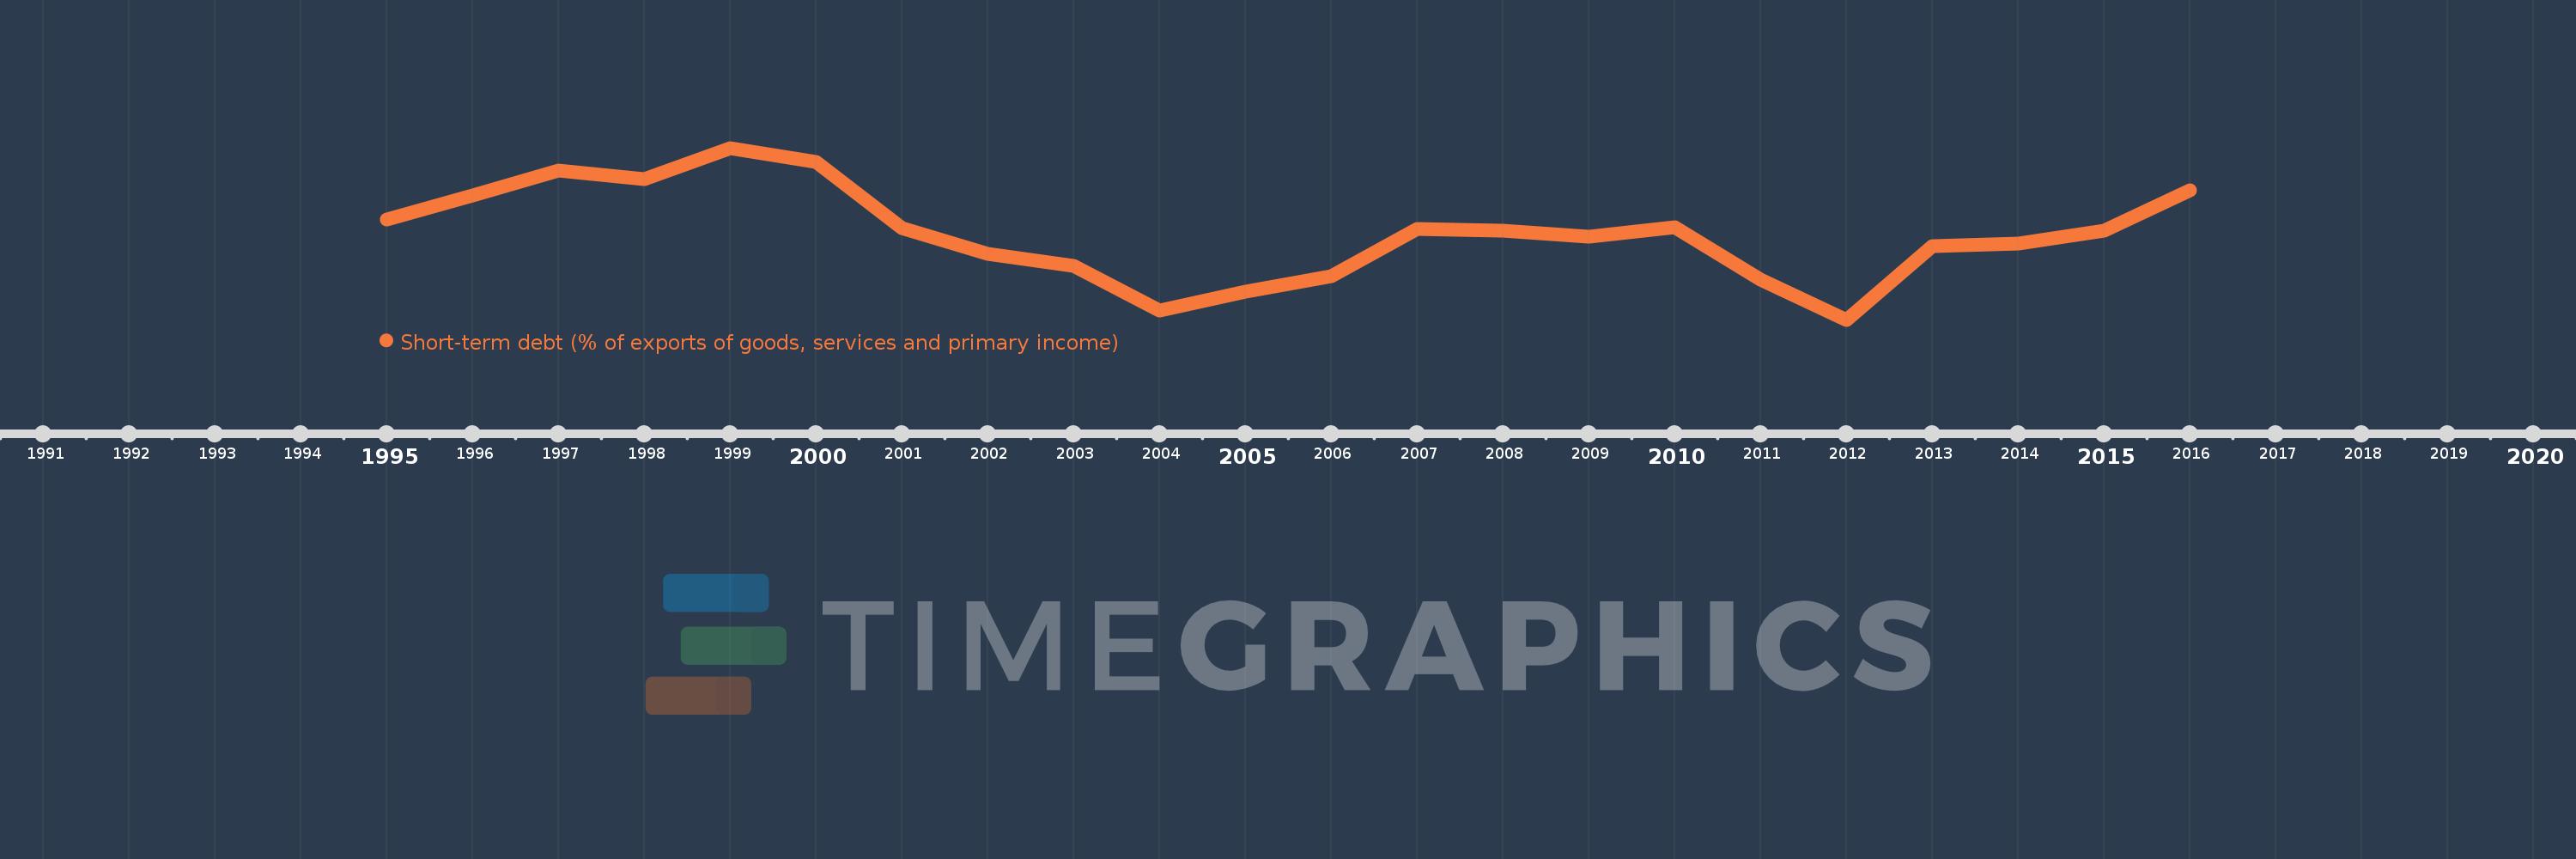
Short-term debt (% of exports of goods, services and primary income)
2016,2015,2014,2013,2012,2011,2010,2009,2008,2007,2006,2005,2004,2003,2002,2001,2000,1999,1998,1997,1996,1995
This statistics in other country:
Timeline:
This timeline shows a graph from 1995 to 2016 of South Africa. No data until 1994. Number of actual observations by date: 22.
Source name:
World Development Indicators
Source organization:
World Bank, International Debt Statistics.
Categories, topics:
Economy & Growth, External Debt
Last updated:
apr 23, 2017
Indicators value changes by year
Minimum:
15.536
jan 1, 2012
Maximum:
31.728
jan 1, 1999
At the date of observation
Value
Absolute change
Change from previous value
jan 1, 1995
24.986
+24.986
0.0%
jan 1, 1996
27.219
+2.233
8.94%
jan 1, 1997
29.618
+2.4
8.82%
jan 1, 1998
28.788
-0.83
-2.8%
jan 1, 1999
31.728
+2.94
10.21%
jan 1, 2000
30.435
-1.293
-4.08%
jan 1, 2001
24.181
-6.254
-20.55%
jan 1, 2002
21.764
-2.417
-9.99%
jan 1, 2003
20.619
-1.145
-5.26%
jan 1, 2004
16.364
-4.255
-20.64%
jan 1, 2005
18.146
+1.782
10.89%
jan 1, 2006
19.629
+1.483
8.17%
jan 1, 2007
24.112
+4.483
22.84%
jan 1, 2008
23.945
-0.166
-0.69%
jan 1, 2009
23.365
-0.58
-2.42%
jan 1, 2010
24.259
+0.894
3.82%
jan 1, 2011
19.335
-4.924
-20.3%
jan 1, 2012
15.536
-3.799
-19.65%
jan 1, 2013
22.513
+6.977
44.91%
jan 1, 2014
22.735
+0.221
0.98%
jan 1, 2015
23.947
+1.212
5.33%
jan 1, 2016
27.743
+3.796
15.85%
Ranking of countries by current statistics by years


Comments: