29
/
en
AIzaSyAYiBZKx7MnpbEhh9jyipgxe19OcubqV5w
April 1, 2024
38592
IDA blend
IDB
false
2
1
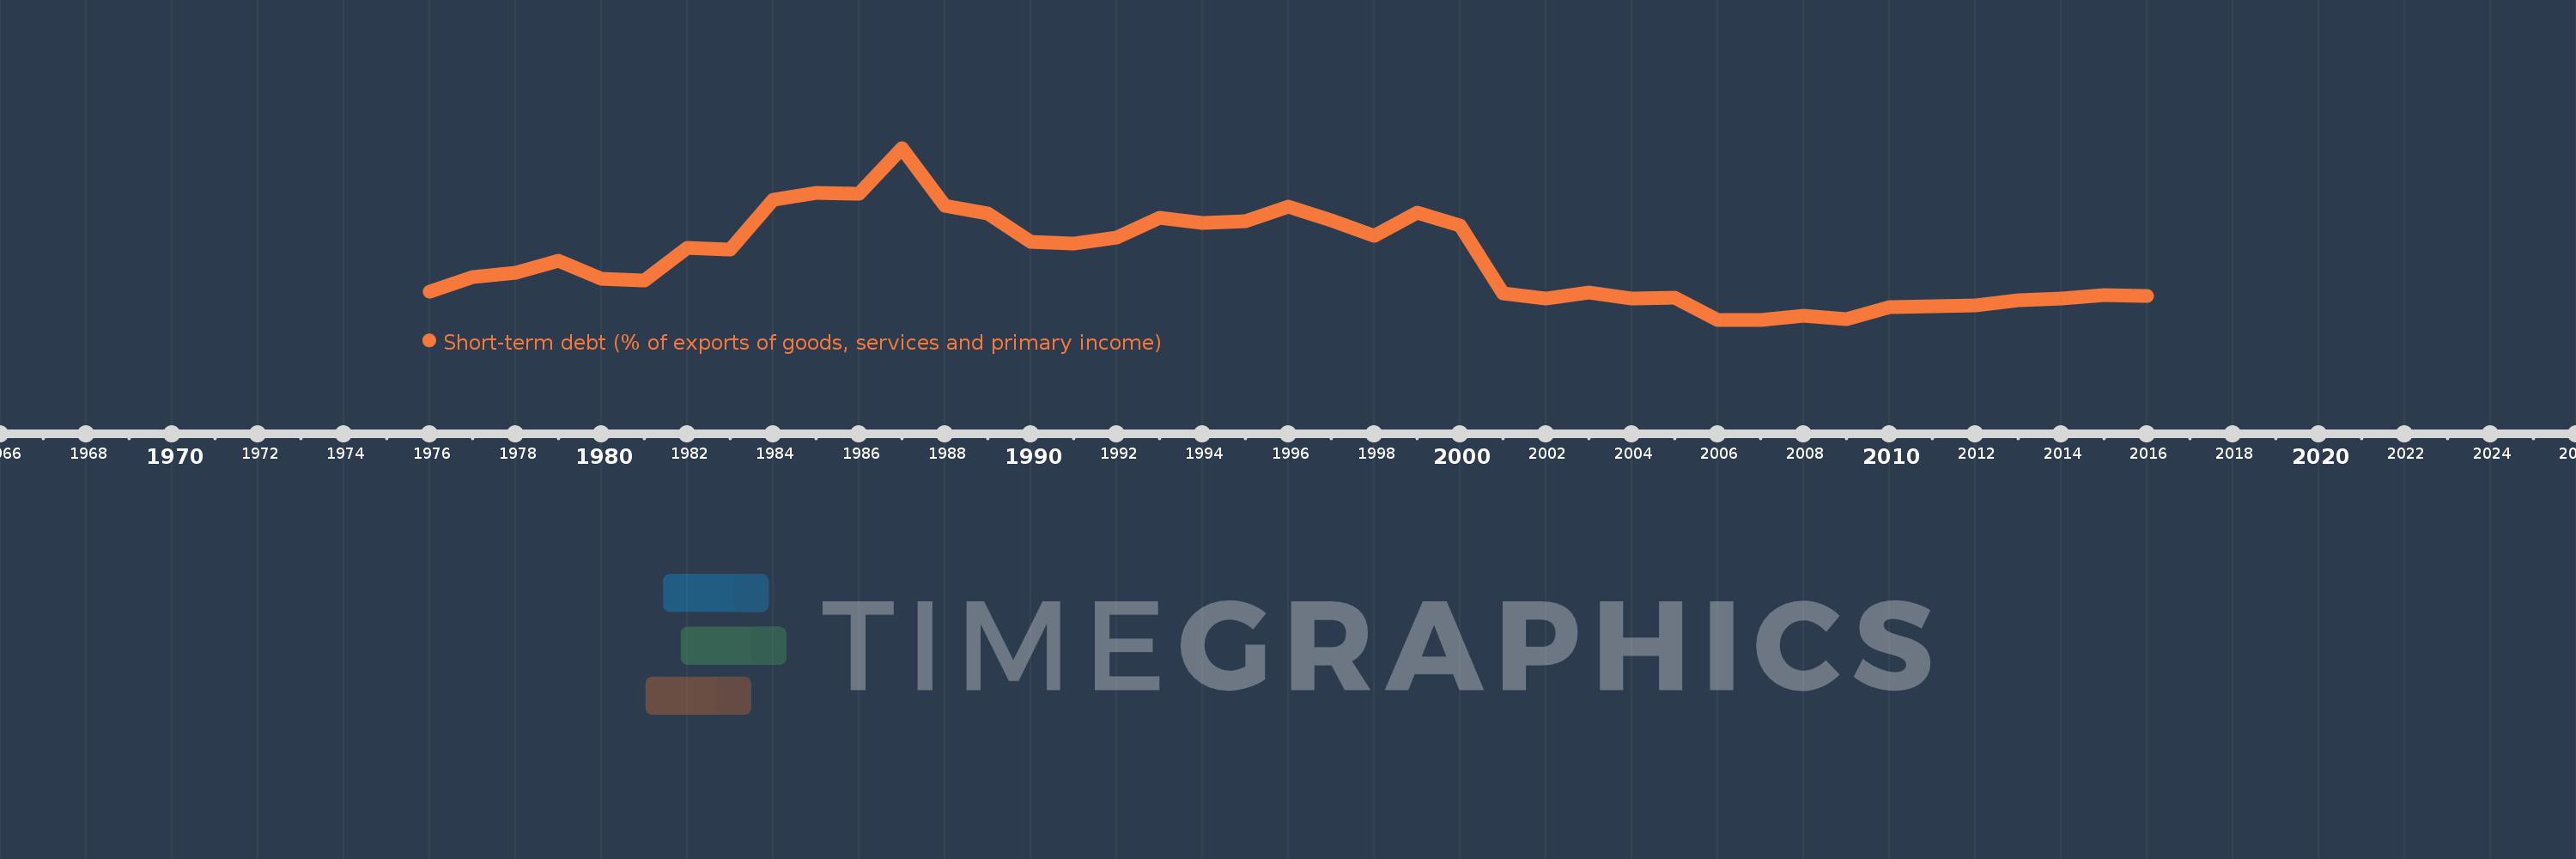
Short-term debt (% of exports of goods, services and primary income)
2016,2015,2014,2013,2012,2011,2010,2009,2008,2007,2006,2005,2004,2003,2002,2001,2000,1999,1998,1997,1996,1995,1994,1993,1992,1991,1990,1989,1988,1987,1986,1985,1984,1983,1982,1981,1980,1979,1978,1977,1976
This statistics in other country:
Timeline:
This timeline shows a graph from 1976 to 2016 of IDA blend. No data until 1975. Number of actual observations by date: 41.
Source name:
World Development Indicators
Source organization:
World Bank, International Debt Statistics.
Categories, topics:
Economy & Growth, External Debt
Last updated:
apr 23, 2017
Indicators value changes by year
At the date of observation
Value
Absolute change
Change from previous value
jan 1, 1976
11.267
+11.267
0.0%
jan 1, 1977
14.773
+3.507
31.13%
jan 1, 1978
15.871
+1.098
7.43%
jan 1, 1979
18.727
+2.856
17.99%
jan 1, 1980
14.277
-4.451
-23.77%
jan 1, 1981
13.93
-0.347
-2.43%
jan 1, 1982
21.663
+7.733
55.51%
jan 1, 1983
21.272
-0.39
-1.8%
jan 1, 1984
33.254
+11.982
56.33%
jan 1, 1985
34.757
+1.503
4.52%
jan 1, 1986
34.612
-0.145
-0.42%
jan 1, 1987
45.58
+10.968
31.69%
jan 1, 1988
31.865
-13.714
-30.09%
jan 1, 1989
29.875
-1.99
-6.25%
jan 1, 1990
23.138
-6.737
-22.55%
jan 1, 1991
22.85
-0.287
-1.24%
jan 1, 1992
24.21
+1.359
5.95%
jan 1, 1993
28.902
+4.692
19.38%
jan 1, 1994
27.668
-1.234
-4.27%
jan 1, 1995
28.058
+0.39
1.41%
jan 1, 1996
31.651
+3.594
12.81%
jan 1, 1997
28.233
-3.418
-10.8%
jan 1, 1998
24.579
-3.654
-12.94%
jan 1, 1999
30.061
+5.482
22.3%
jan 1, 2000
27.09
-2.971
-9.88%
jan 1, 2001
10.964
-16.126
-59.53%
jan 1, 2002
9.567
-1.397
-12.74%
jan 1, 2003
11.0
+1.433
14.98%
jan 1, 2004
9.639
-1.361
-12.38%
jan 1, 2005
9.773
+0.135
1.4%
jan 1, 2006
4.566
-5.207
-53.28%
jan 1, 2007
4.603
+0.036
0.8%
jan 1, 2008
5.453
+0.851
18.48%
jan 1, 2009
4.679
-0.775
-14.21%
jan 1, 2010
7.605
+2.926
62.53%
jan 1, 2011
7.834
+0.23
3.02%
jan 1, 2012
7.901
+0.067
0.86%
jan 1, 2013
9.157
+1.255
15.88%
jan 1, 2014
9.66
+0.503
5.5%
jan 1, 2015
10.431
+0.771
7.99%
jan 1, 2016
10.289
-0.142
-1.36%
Ranking of countries by current statistics by years


Comments: