29
/
en
AIzaSyAYiBZKx7MnpbEhh9jyipgxe19OcubqV5w
April 1, 2024
287927
Zimbabwe
ZWE
true
2
1
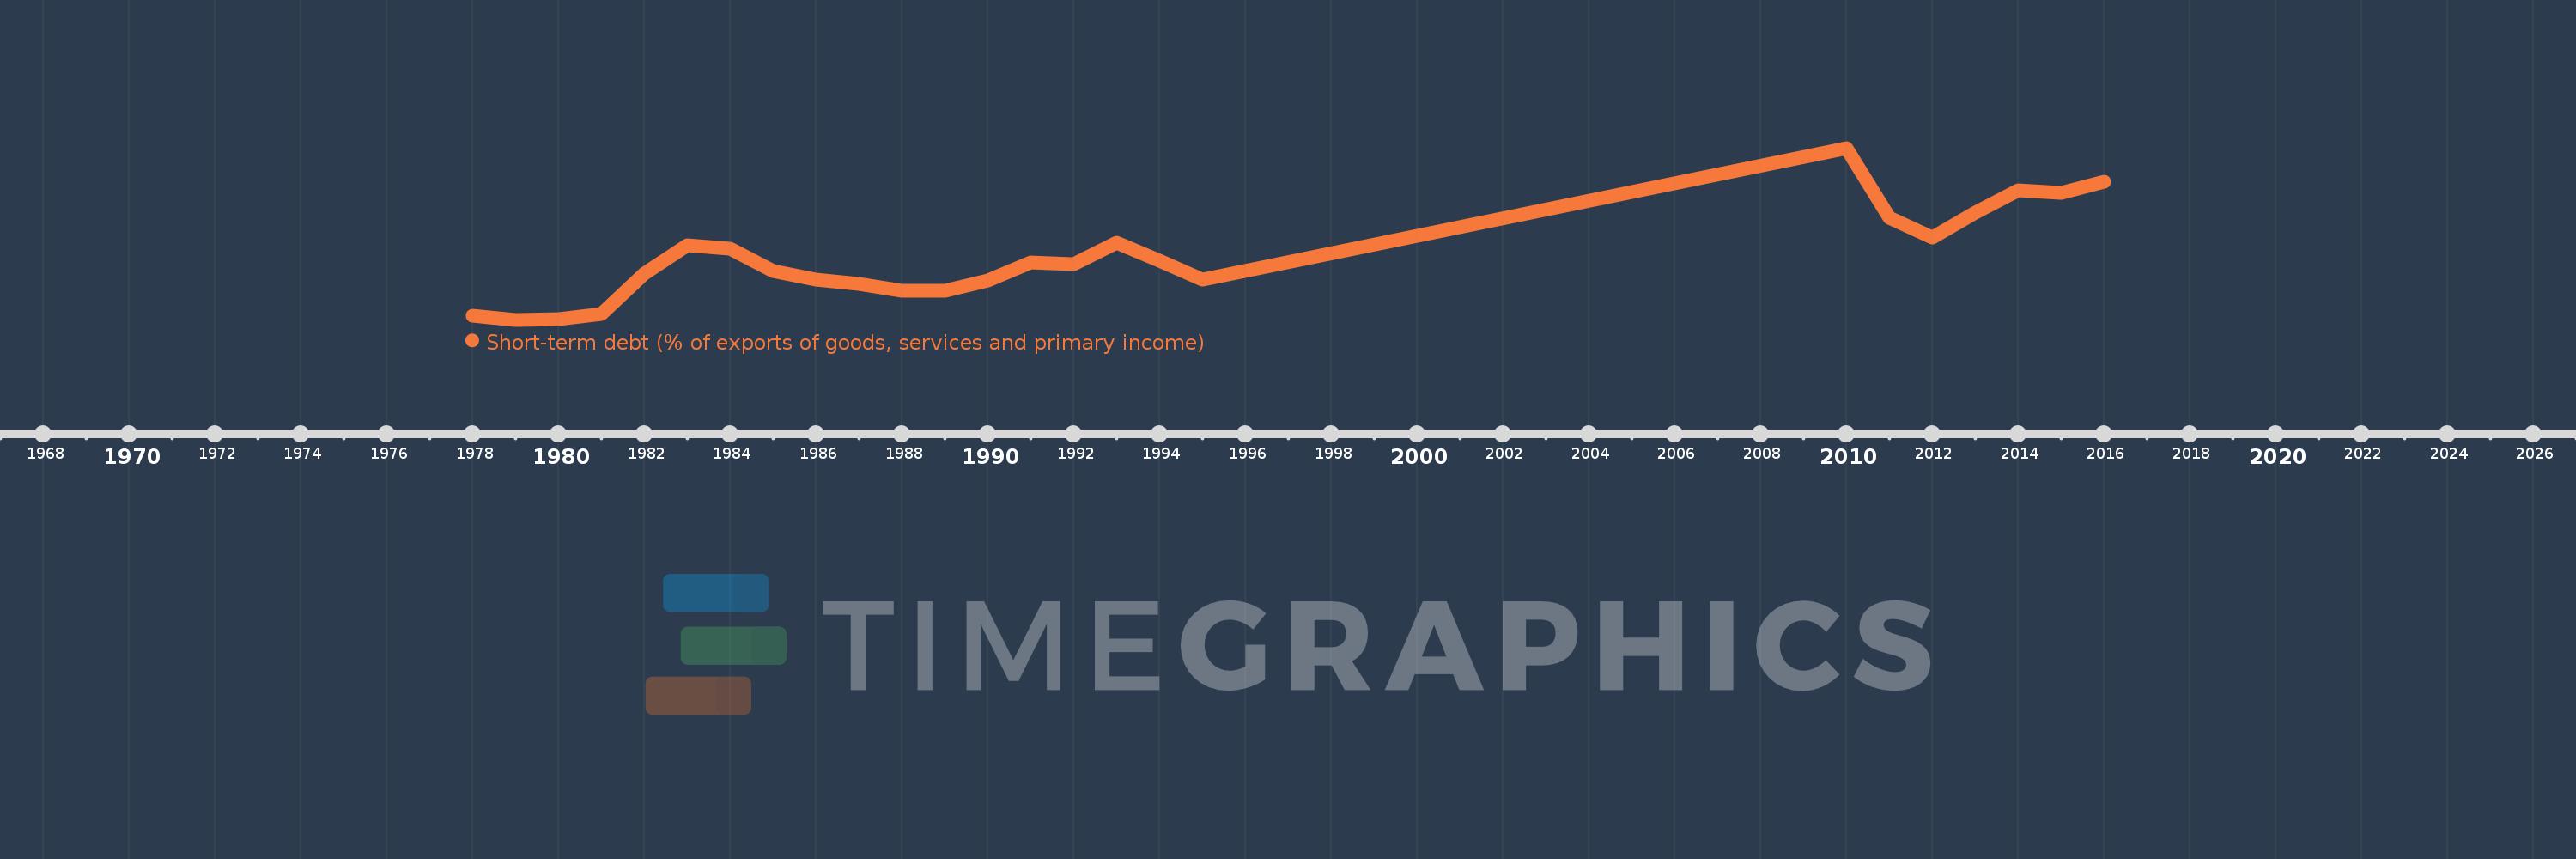
Short-term debt (% of exports of goods, services and primary income)
2016,2015,2014,2013,2012,2011,2010,1995,1994,1993,1992,1991,1990,1989,1988,1987,1986,1985,1984,1983,1982,1981,1980,1979,1978
This statistics in other country:
Timeline:
This timeline shows a graph from 1978 to 2016 of Zimbabwe. No data until 1977. Number of actual observations by date: 25.
Source name:
World Development Indicators
Source organization:
World Bank, International Debt Statistics.
Categories, topics:
Economy & Growth, External Debt
Last updated:
apr 23, 2017
Indicators value changes by year
At the date of observation
Value
Absolute change
Change from previous value
jan 1, 1978
4.582
+4.582
0.0%
jan 1, 1979
2.711
-1.871
-40.83%
jan 1, 1980
2.847
+0.136
5.0%
jan 1, 1981
5.256
+2.409
84.63%
jan 1, 1982
23.723
+18.467
351.33%
jan 1, 1983
37.018
+13.295
56.04%
jan 1, 1984
35.192
-1.826
-4.93%
jan 1, 1985
25.173
-10.019
-28.47%
jan 1, 1986
21.224
-3.949
-15.69%
jan 1, 1987
19.005
-2.219
-10.45%
jan 1, 1988
15.897
-3.108
-16.35%
jan 1, 1989
16.069
+0.172
1.08%
jan 1, 1990
20.945
+4.876
30.34%
jan 1, 1991
29.055
+8.111
38.72%
jan 1, 1992
28.149
-0.906
-3.12%
jan 1, 1993
38.027
+9.878
35.09%
jan 1, 1994
29.816
-8.212
-21.59%
jan 1, 1995
20.973
-8.843
-29.66%
jan 1, 2010
81.66
+60.687
289.36%
jan 1, 2011
49.75
-31.909
-39.08%
jan 1, 2012
40.439
-9.311
-18.72%
jan 1, 2013
52.061
+11.622
28.74%
jan 1, 2014
62.037
+9.976
19.16%
jan 1, 2015
61.042
-0.995
-1.6%
jan 1, 2016
66.259
+5.217
8.55%
Ranking of countries by current statistics by years


Comments: