29
/
en
AIzaSyAYiBZKx7MnpbEhh9jyipgxe19OcubqV5w
April 1, 2024
109117
Comoros
COM
true
2
1
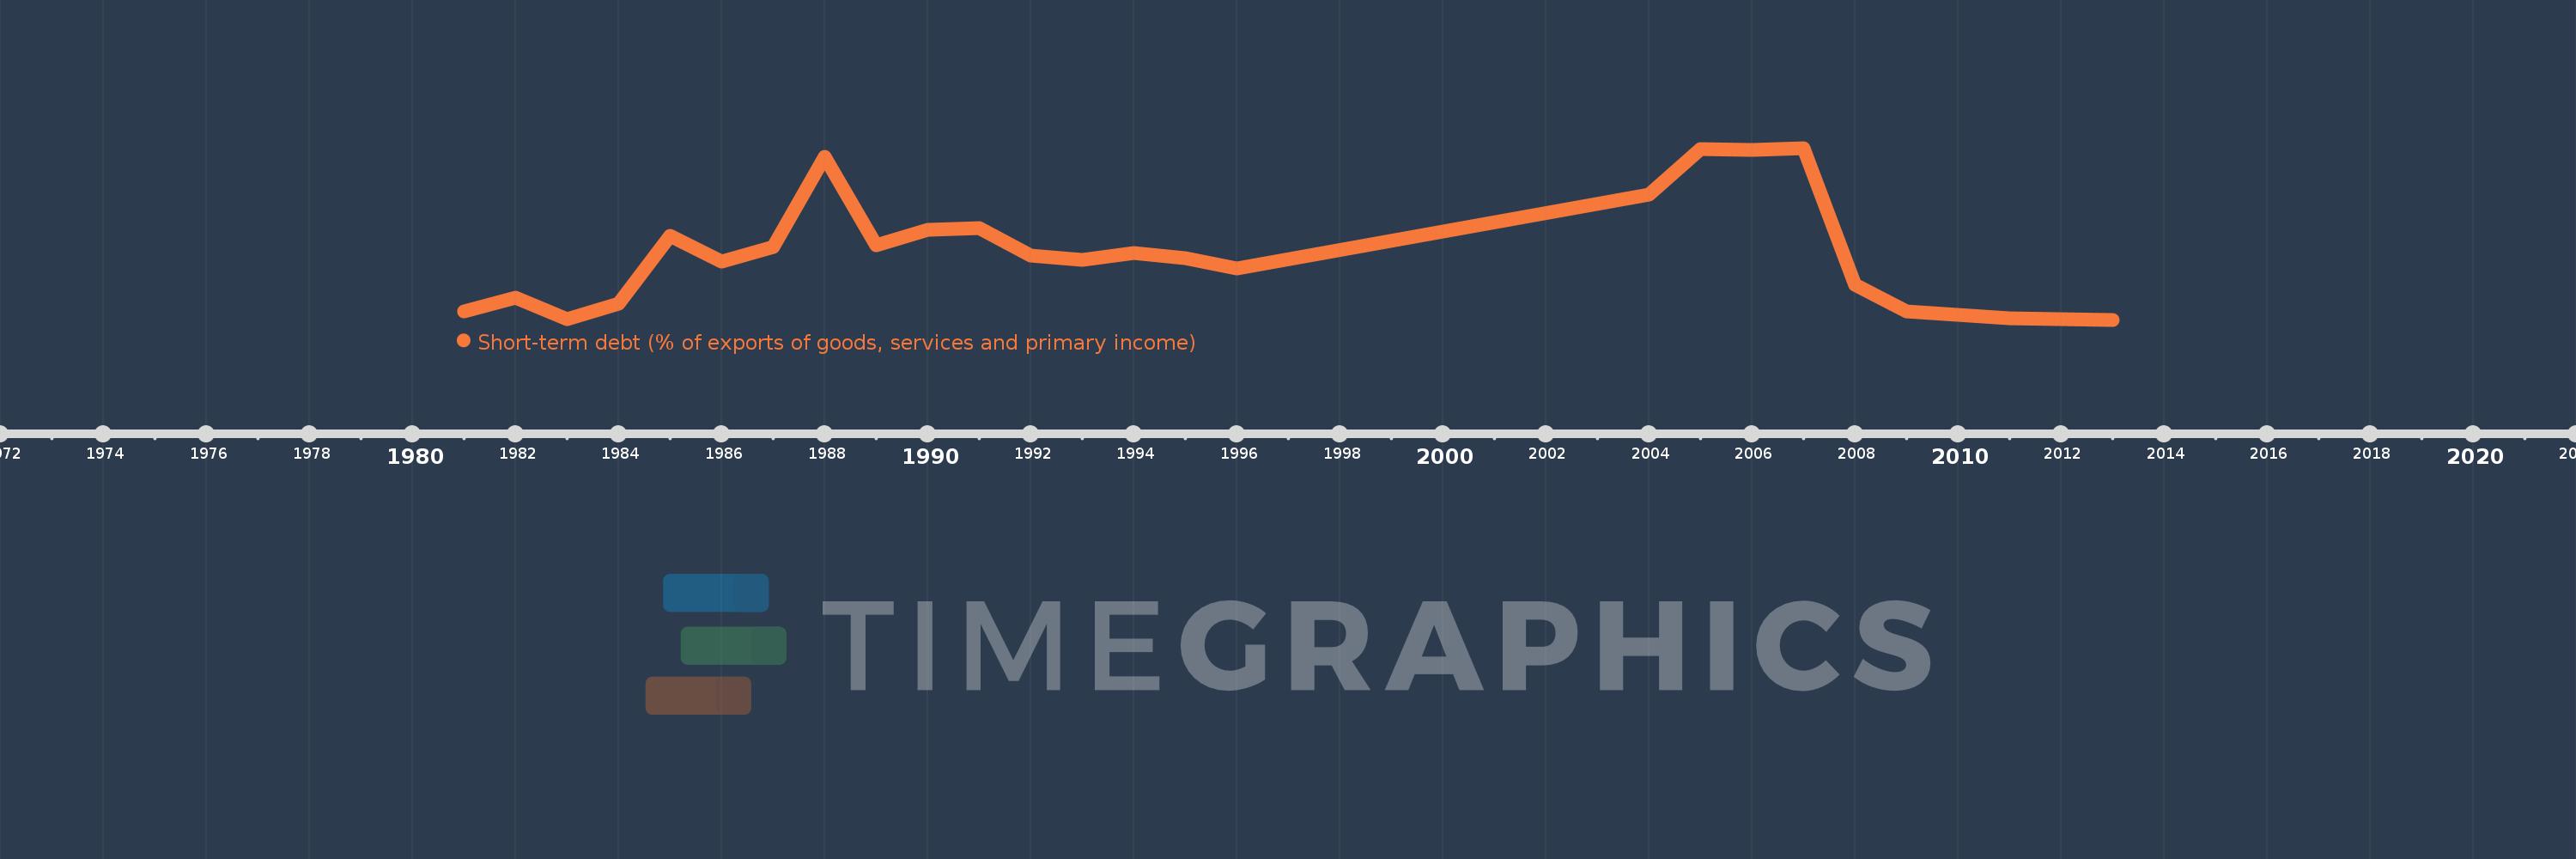
Short-term debt (% of exports of goods, services and primary income)
2013,2012,2011,2010,2009,2008,2007,2006,2005,2004,1996,1995,1994,1993,1992,1991,1990,1989,1988,1987,1986,1985,1984,1983,1982,1981
This statistics in other country:
Timeline:
This timeline shows a graph from 1981 to 2013 of Comoros. No data until 1980. Number of actual observations by date: 26.
Source name:
World Development Indicators
Source organization:
World Bank, International Debt Statistics.
Categories, topics:
Economy & Growth, External Debt
Last updated:
apr 23, 2017
Indicators value changes by year
Maximum:
57.217
jan 1, 2007
At the date of observation
Value
Absolute change
Change from previous value
jan 1, 1981
7.126
+7.126
0.0%
jan 1, 1982
11.205
+4.08
57.25%
jan 1, 1983
4.738
-6.467
-57.71%
jan 1, 1984
9.289
+4.551
96.05%
jan 1, 1985
30.267
+20.978
225.83%
jan 1, 1986
22.297
-7.97
-26.33%
jan 1, 1987
26.913
+4.616
20.7%
jan 1, 1988
54.47
+27.557
102.39%
jan 1, 1989
27.442
-27.028
-49.62%
jan 1, 1990
32.031
+4.588
16.72%
jan 1, 1991
32.493
+0.462
1.44%
jan 1, 1992
24.147
-8.346
-25.69%
jan 1, 1993
22.889
-1.257
-5.21%
jan 1, 1994
25.021
+2.132
9.31%
jan 1, 1995
23.298
-1.723
-6.89%
jan 1, 1996
20.29
-3.008
-12.91%
jan 1, 2004
42.929
+22.638
111.57%
jan 1, 2005
56.985
+14.056
32.74%
jan 1, 2006
56.66
-0.325
-0.57%
jan 1, 2007
57.217
+0.557
0.98%
jan 1, 2008
15.135
-42.082
-73.55%
jan 1, 2009
7.03
-8.105
-53.55%
jan 1, 2010
5.866
-1.164
-16.55%
jan 1, 2011
4.881
-0.985
-16.8%
jan 1, 2012
4.535
-0.345
-7.08%
jan 1, 2013
4.438
-0.097
-2.14%
Ranking of countries by current statistics by years


Comments: