29
/
en
AIzaSyAYiBZKx7MnpbEhh9jyipgxe19OcubqV5w
April 1, 2024
46683
Low income
LIC
false
2
1
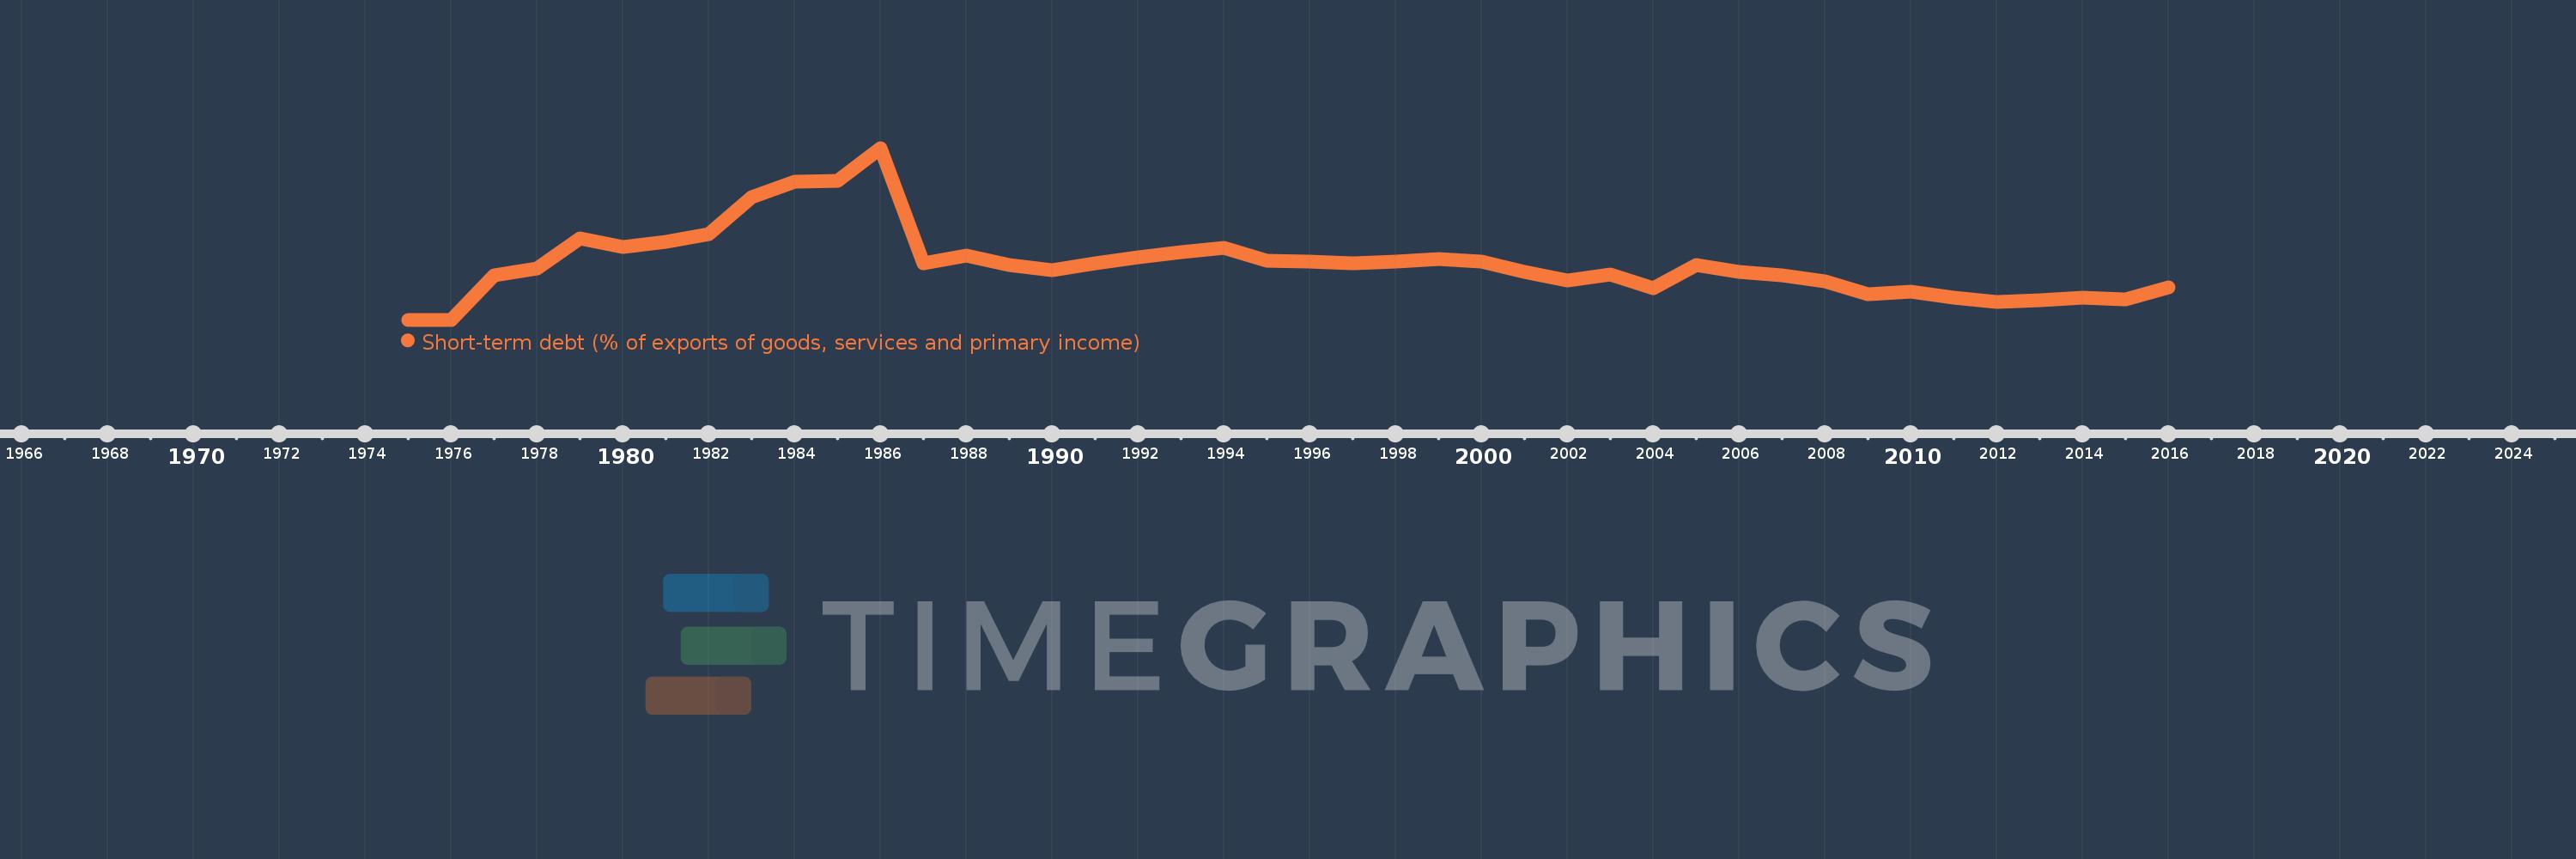
Short-term debt (% of exports of goods, services and primary income)
2016,2015,2014,2013,2012,2011,2010,2009,2008,2007,2006,2005,2004,2003,2002,2001,2000,1999,1998,1997,1996,1995,1994,1993,1992,1991,1990,1989,1988,1987,1986,1985,1984,1983,1982,1981,1980,1979,1978,1977,1976,1975
This statistics in other country:
Timeline:
This timeline shows a graph from 1975 to 2016 of Low income. No data until 1974. Number of actual observations by date: 42.
Source name:
World Development Indicators
Source organization:
World Bank, International Debt Statistics.
Categories, topics:
Economy & Growth, External Debt
Last updated:
apr 23, 2017
Indicators value changes by year
Maximum:
84.327
jan 1, 1986
At the date of observation
Value
Absolute change
Change from previous value
jan 1, 1975
0.356
+0.356
0.0%
jan 1, 1976
0.409
+0.053
14.84%
jan 1, 1977
22.13
+21.721
5.31K%
jan 1, 1978
25.478
+3.348
15.13%
jan 1, 1979
40.045
+14.567
57.17%
jan 1, 1980
35.787
-4.258
-10.63%
jan 1, 1981
38.501
+2.714
7.59%
jan 1, 1982
42.185
+3.683
9.57%
jan 1, 1983
60.255
+18.07
42.84%
jan 1, 1984
67.761
+7.506
12.46%
jan 1, 1985
68.373
+0.612
0.9%
jan 1, 1986
84.327
+15.955
23.34%
jan 1, 1987
28.058
-56.269
-66.73%
jan 1, 1988
31.843
+3.785
13.49%
jan 1, 1989
27.119
-4.724
-14.84%
jan 1, 1990
24.386
-2.734
-10.08%
jan 1, 1991
28.006
+3.621
14.85%
jan 1, 1992
31.011
+3.004
10.73%
jan 1, 1993
33.492
+2.481
8.0%
jan 1, 1994
35.43
+1.938
5.79%
jan 1, 1995
29.008
-6.423
-18.13%
jan 1, 1996
28.928
-0.08
-0.28%
jan 1, 1997
28.009
-0.919
-3.18%
jan 1, 1998
28.719
+0.71
2.54%
jan 1, 1999
29.918
+1.199
4.17%
jan 1, 2000
28.666
-1.252
-4.19%
jan 1, 2001
23.9
-4.766
-16.63%
jan 1, 2002
19.334
-4.566
-19.1%
jan 1, 2003
22.404
+3.07
15.88%
jan 1, 2004
15.748
-6.655
-29.71%
jan 1, 2005
27.22
+11.471
72.84%
jan 1, 2006
23.788
-3.432
-12.61%
jan 1, 2007
21.999
-1.789
-7.52%
jan 1, 2008
19.133
-2.866
-13.03%
jan 1, 2009
12.876
-6.257
-32.7%
jan 1, 2010
14.243
+1.368
10.62%
jan 1, 2011
11.143
-3.101
-21.77%
jan 1, 2012
9.239
-1.904
-17.09%
jan 1, 2013
9.996
+0.757
8.2%
jan 1, 2014
11.086
+1.09
10.91%
jan 1, 2015
10.285
-0.801
-7.22%
jan 1, 2016
16.303
+6.017
58.5%
Ranking of countries by current statistics by years


Comments: