29
/
en
AIzaSyAYiBZKx7MnpbEhh9jyipgxe19OcubqV5w
April 1, 2024
111638
Congo, Rep.
COG
true
2
1
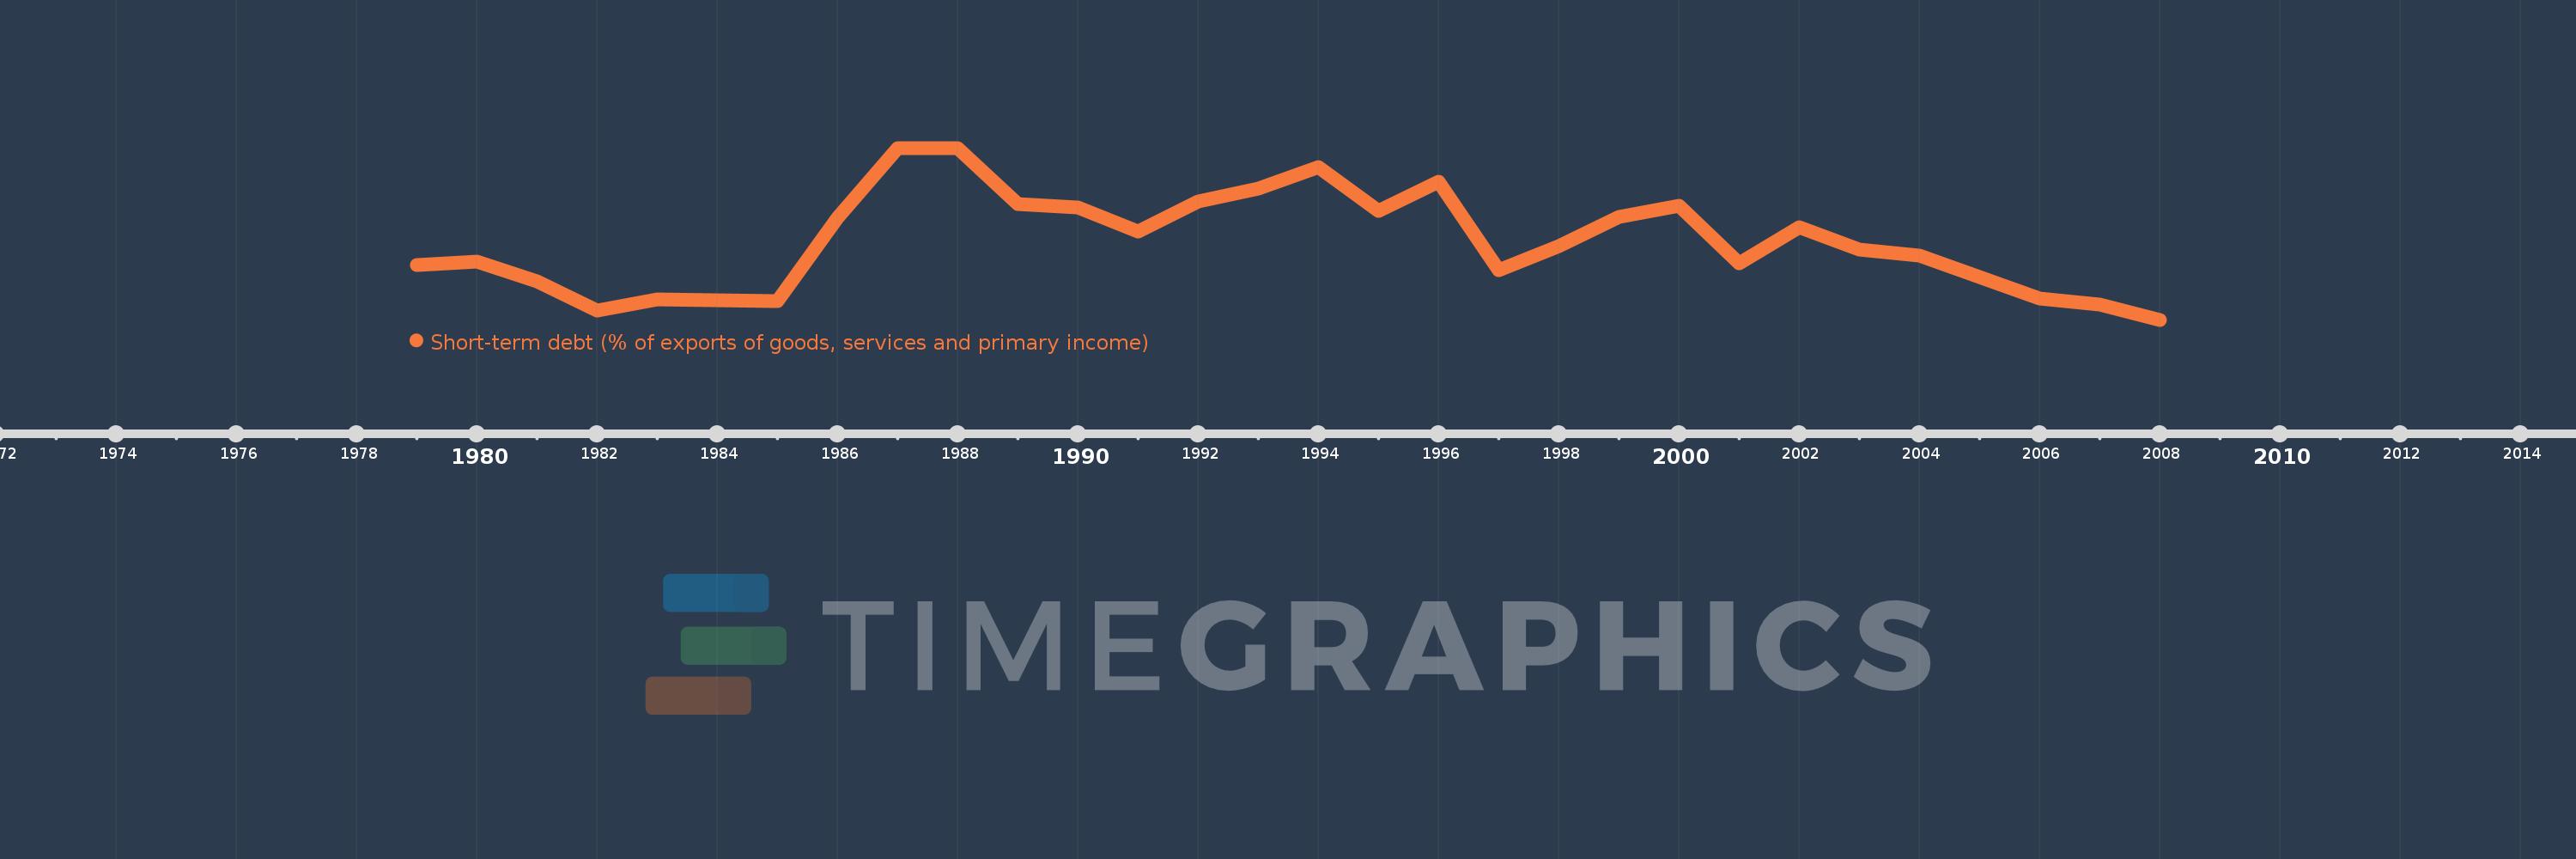
Short-term debt (% of exports of goods, services and primary income)
2008,2007,2006,2005,2004,2003,2002,2001,2000,1999,1998,1997,1996,1995,1994,1993,1992,1991,1990,1989,1988,1987,1986,1985,1984,1983,1982,1981,1980,1979
This statistics in other country:
Timeline:
This timeline shows a graph from 1979 to 2008 of Congo, Rep.. No data until 1978. Number of actual observations by date: 30.
Source name:
World Development Indicators
Source organization:
World Bank, International Debt Statistics.
Categories, topics:
Economy & Growth, External Debt
Last updated:
apr 23, 2017
Indicators value changes by year
Maximum:
89.455
jan 1, 1987
At the date of observation
Value
Absolute change
Change from previous value
jan 1, 1979
32.016
+32.016
0.0%
jan 1, 1980
33.745
+1.729
5.4%
jan 1, 1981
23.987
-9.758
-28.92%
jan 1, 1982
9.927
-14.06
-58.61%
jan 1, 1983
15.45
+5.522
55.63%
jan 1, 1984
14.847
-0.603
-3.9%
jan 1, 1985
14.327
-0.519
-3.5%
jan 1, 1986
55.265
+40.938
285.73%
jan 1, 1987
89.455
+34.189
61.86%
jan 1, 1988
89.277
-0.178
-0.2%
jan 1, 1989
62.054
-27.222
-30.49%
jan 1, 1990
60.202
-1.852
-2.98%
jan 1, 1991
48.704
-11.498
-19.1%
jan 1, 1992
63.265
+14.561
29.9%
jan 1, 1993
69.708
+6.443
10.18%
jan 1, 1994
79.875
+10.167
14.58%
jan 1, 1995
58.543
-21.332
-26.71%
jan 1, 1996
73.072
+14.528
24.82%
jan 1, 1997
29.365
-43.707
-59.81%
jan 1, 1998
41.424
+12.06
41.07%
jan 1, 1999
55.502
+14.077
33.98%
jan 1, 2000
61.311
+5.81
10.47%
jan 1, 2001
33.074
-28.237
-46.06%
jan 1, 2002
50.656
+17.582
53.16%
jan 1, 2003
39.571
-11.085
-21.88%
jan 1, 2004
36.898
-2.673
-6.76%
jan 1, 2005
26.079
-10.819
-29.32%
jan 1, 2006
15.806
-10.273
-39.39%
jan 1, 2007
12.816
-2.99
-18.91%
jan 1, 2008
5.293
-7.523
-58.7%
Ranking of countries by current statistics by years


Comments: