29
/
en
AIzaSyAYiBZKx7MnpbEhh9jyipgxe19OcubqV5w
April 1, 2024
204743
Myanmar
MMR
true
2
1
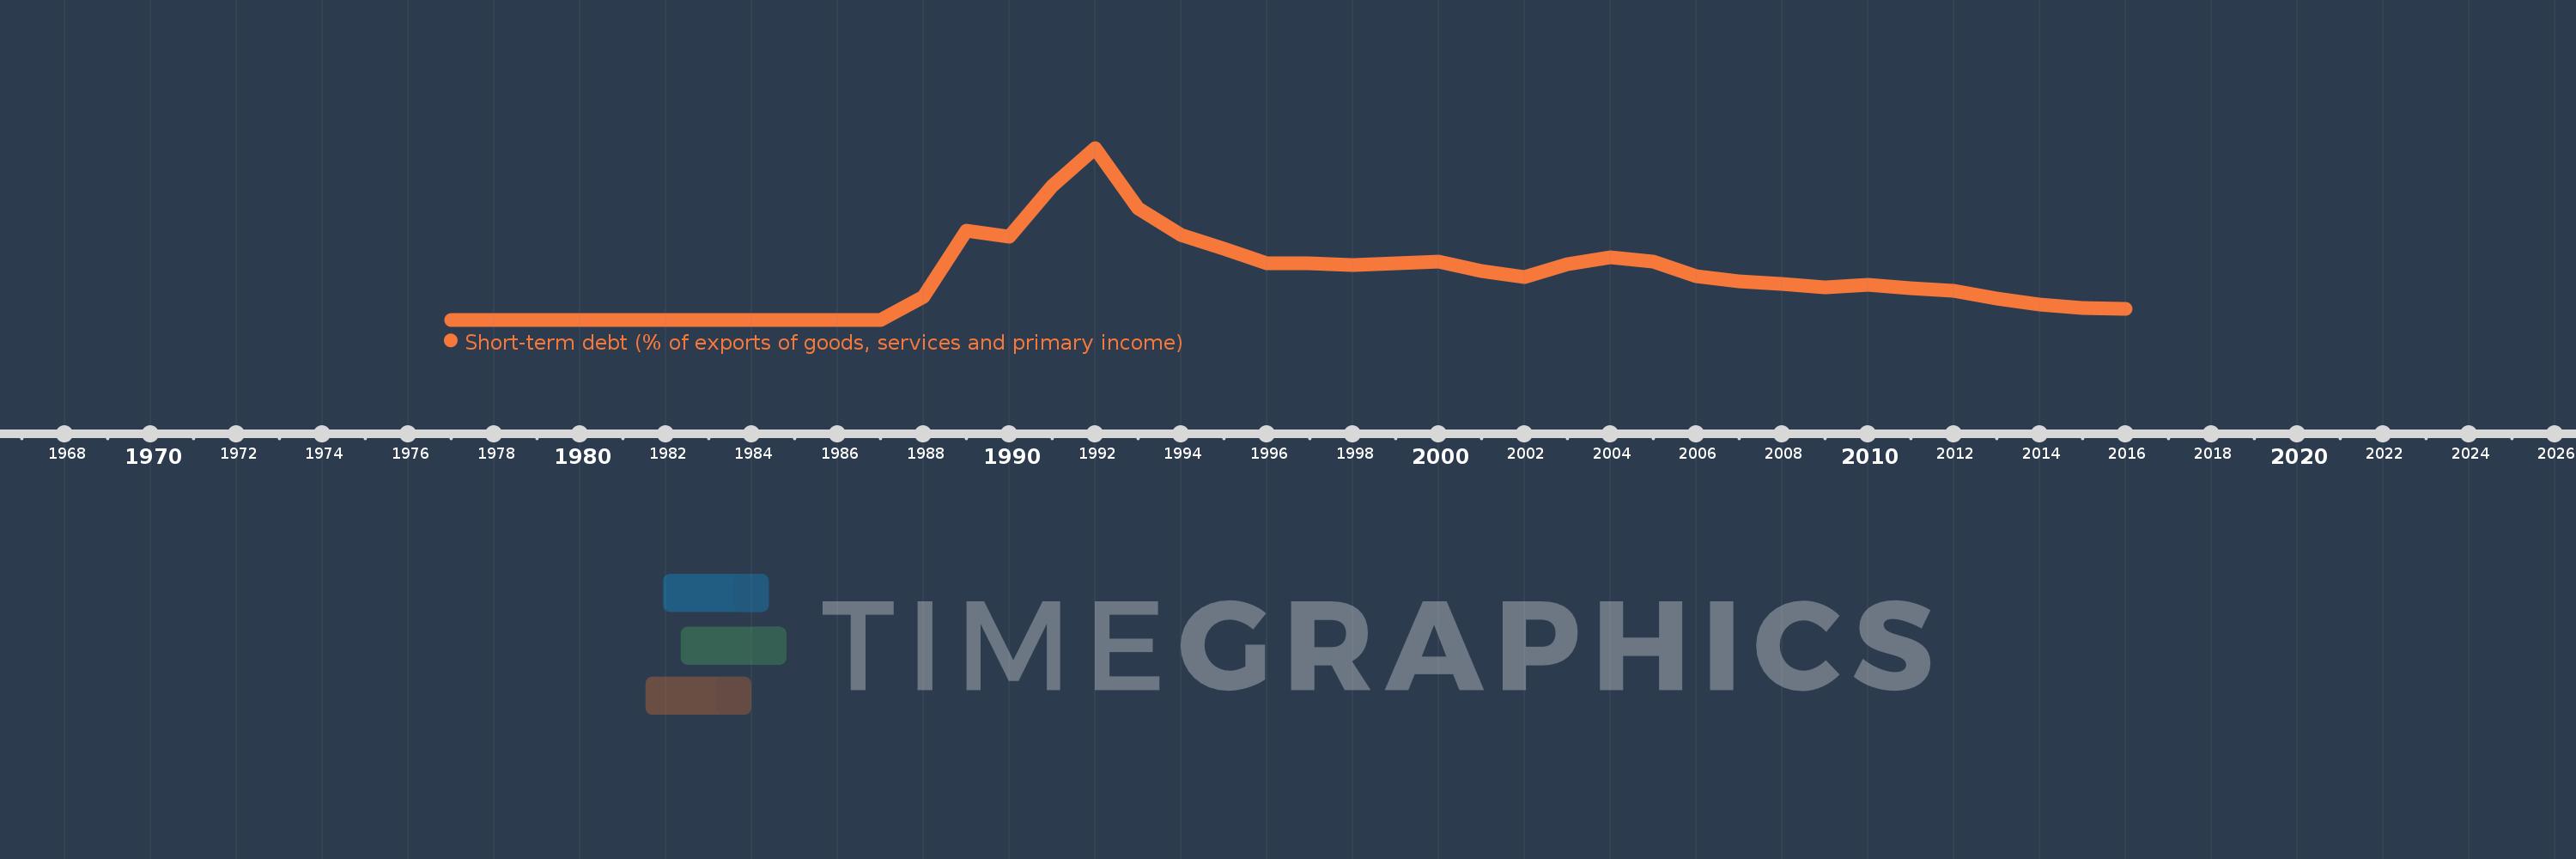
Short-term debt (% of exports of goods, services and primary income)
2016,2015,2014,2013,2012,2011,2010,2009,2008,2007,2006,2005,2004,2003,2002,2001,2000,1999,1998,1997,1996,1995,1994,1993,1992,1991,1990,1989,1988,1987,1986,1985,1984,1983,1982,1981,1980,1979,1978,1977
This statistics in other country:
Timeline:
This timeline shows a graph from 1977 to 2016 of Myanmar. No data until 1976. Number of actual observations by date: 40.
Source name:
World Development Indicators
Source organization:
World Bank, International Debt Statistics.
Categories, topics:
Economy & Growth, External Debt
Last updated:
apr 23, 2017
Indicators value changes by year
Maximum:
81.341
jan 1, 1992
At the date of observation
Value
Absolute change
Change from previous value
jan 1, 1977
0.015
+0.015
0.0%
jan 1, 1978
0.025
+0.01
71.42%
jan 1, 1979
0.031
+0.006
24.96%
jan 1, 1980
0.031
0.0
-0.16%
jan 1, 1981
0.033
+0.002
5.07%
jan 1, 1982
0.031
-0.002
-4.57%
jan 1, 1983
0.044
+0.013
41.42%
jan 1, 1984
0.051
+0.007
15.46%
jan 1, 1985
0.052
+0.001
2.03%
jan 1, 1986
0.06
+0.008
14.5%
jan 1, 1987
0.057
-0.003
-5.38%
jan 1, 1988
10.941
+10.885
19.24K%
jan 1, 1989
42.059
+31.117
284.41%
jan 1, 1990
39.314
-2.745
-6.53%
jan 1, 1991
63.174
+23.861
60.69%
jan 1, 1992
81.341
+18.166
28.76%
jan 1, 1993
52.608
-28.732
-35.32%
jan 1, 1994
40.164
-12.444
-23.65%
jan 1, 1995
33.528
-6.636
-16.52%
jan 1, 1996
26.853
-6.675
-19.91%
jan 1, 1997
26.644
-0.209
-0.78%
jan 1, 1998
25.975
-0.669
-2.51%
jan 1, 1999
26.786
+0.812
3.12%
jan 1, 2000
27.704
+0.918
3.43%
jan 1, 2001
22.951
-4.753
-17.16%
jan 1, 2002
20.293
-2.658
-11.58%
jan 1, 2003
26.441
+6.147
30.29%
jan 1, 2004
29.55
+3.109
11.76%
jan 1, 2005
27.746
-1.803
-6.1%
jan 1, 2006
20.75
-6.997
-25.22%
jan 1, 2007
18.386
-2.364
-11.39%
jan 1, 2008
17.129
-1.257
-6.84%
jan 1, 2009
15.52
-1.609
-9.39%
jan 1, 2010
16.709
+1.189
7.66%
jan 1, 2011
15.046
-1.663
-9.95%
jan 1, 2012
13.759
-1.286
-8.55%
jan 1, 2013
10.023
-3.736
-27.15%
jan 1, 2014
7.212
-2.811
-28.05%
jan 1, 2015
5.59
-1.622
-22.49%
jan 1, 2016
5.325
-0.265
-4.75%
Ranking of countries by current statistics by years


Comments: