29
/
en
AIzaSyAYiBZKx7MnpbEhh9jyipgxe19OcubqV5w
April 1, 2024
136187
Gabon
GAB
true
2
1
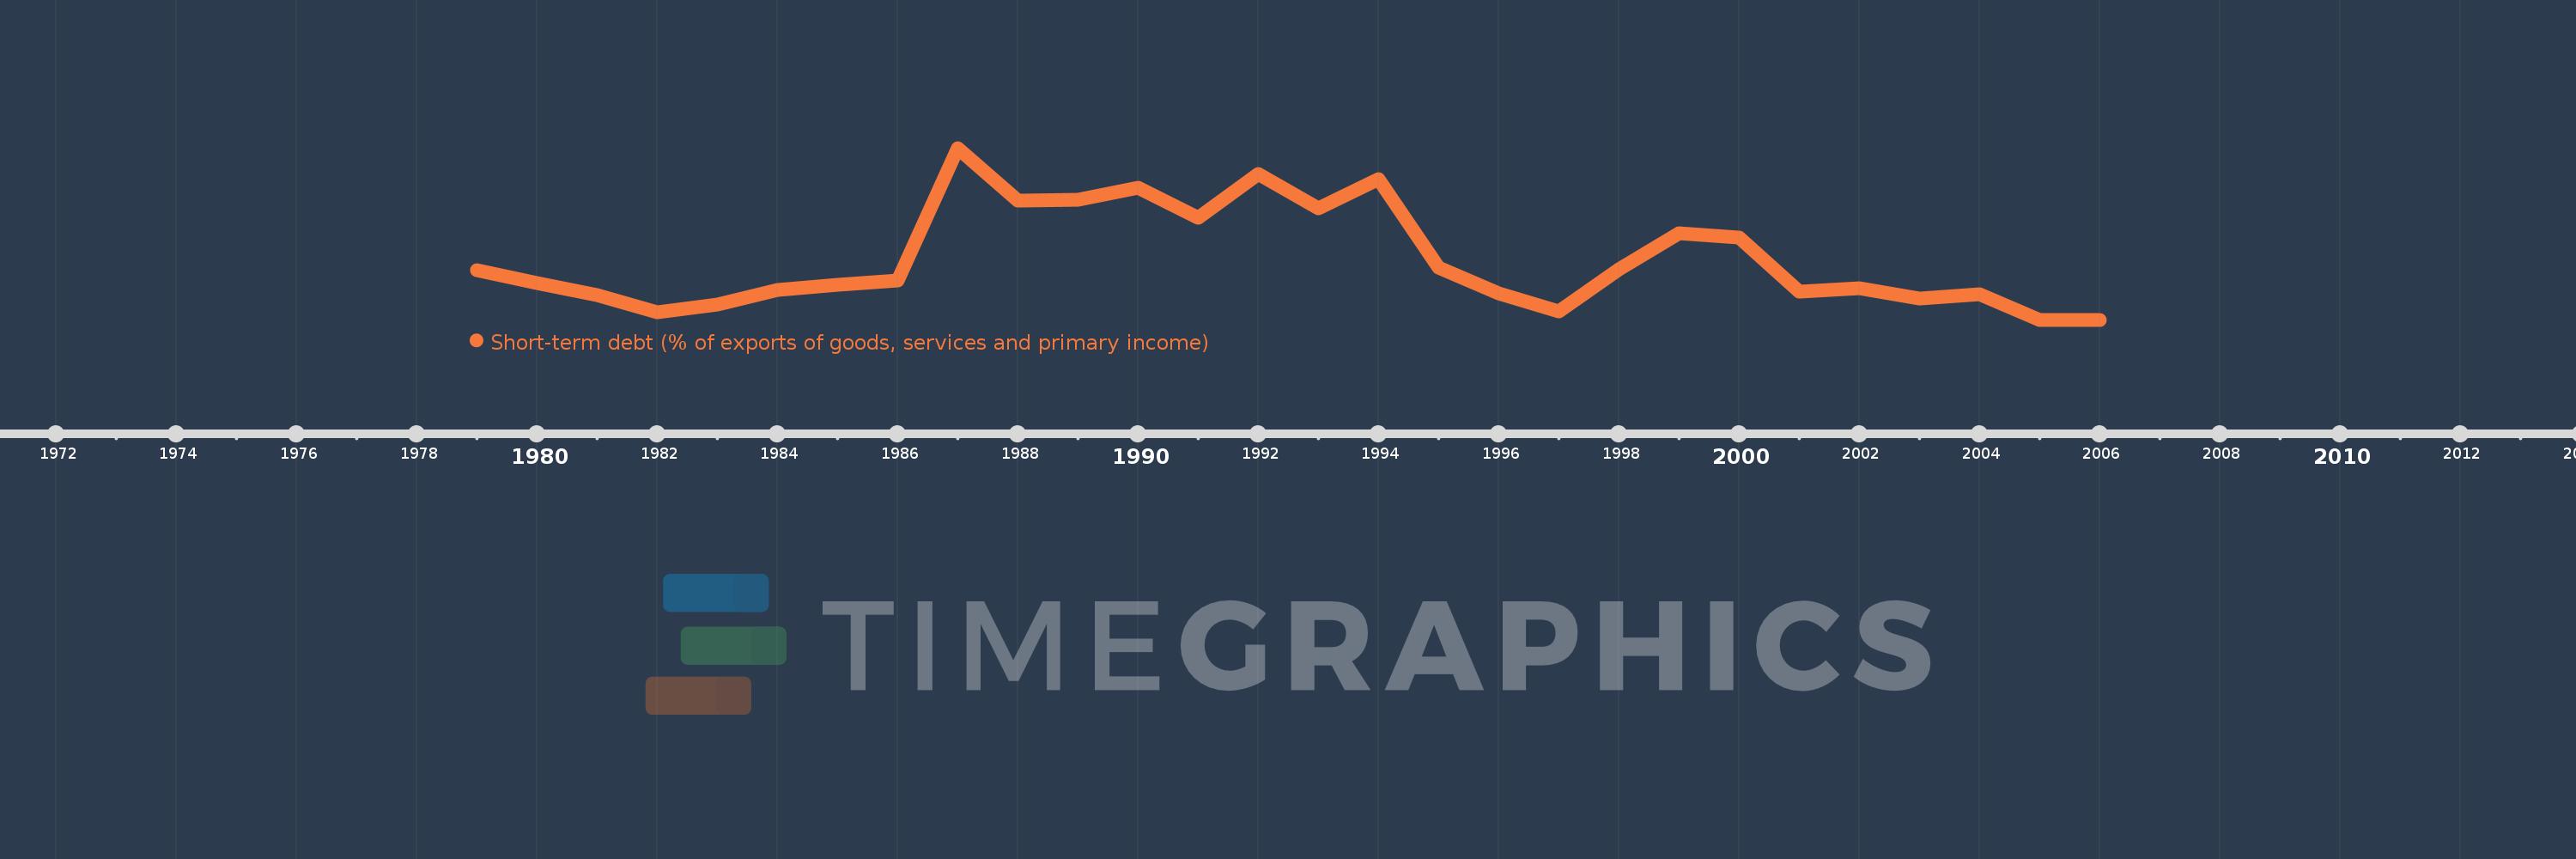
Short-term debt (% of exports of goods, services and primary income)
2006,2005,2004,2003,2002,2001,2000,1999,1998,1997,1996,1995,1994,1993,1992,1991,1990,1989,1988,1987,1986,1985,1984,1983,1982,1981,1980,1979
This statistics in other country:
Timeline:
This timeline shows a graph from 1979 to 2006 of Gabon. No data until 1978. Number of actual observations by date: 28.
Source name:
World Development Indicators
Source organization:
World Bank, International Debt Statistics.
Categories, topics:
Economy & Growth, External Debt
Last updated:
apr 23, 2017
Indicators value changes by year
Maximum:
39.407
jan 1, 1987
At the date of observation
Value
Absolute change
Change from previous value
jan 1, 1979
14.431
+14.431
0.0%
jan 1, 1980
11.865
-2.566
-17.78%
jan 1, 1981
9.369
-2.496
-21.04%
jan 1, 1982
5.808
-3.561
-38.01%
jan 1, 1983
7.36
+1.552
26.72%
jan 1, 1984
10.387
+3.027
41.13%
jan 1, 1985
11.396
+1.009
9.71%
jan 1, 1986
12.364
+0.968
8.5%
jan 1, 1987
39.407
+27.043
218.73%
jan 1, 1988
28.657
-10.75
-27.28%
jan 1, 1989
28.898
+0.241
0.84%
jan 1, 1990
31.279
+2.381
8.24%
jan 1, 1991
25.182
-6.098
-19.49%
jan 1, 1992
34.025
+8.843
35.12%
jan 1, 1993
27.155
-6.87
-20.19%
jan 1, 1994
33.074
+5.919
21.8%
jan 1, 1995
14.909
-18.165
-54.92%
jan 1, 1996
9.649
-5.26
-35.28%
jan 1, 1997
6.071
-3.579
-37.09%
jan 1, 1998
14.591
+8.52
140.34%
jan 1, 1999
21.907
+7.316
50.14%
jan 1, 2000
21.076
-0.831
-3.79%
jan 1, 2001
10.038
-11.038
-52.37%
jan 1, 2002
10.711
+0.674
6.71%
jan 1, 2003
8.675
-2.037
-19.01%
jan 1, 2004
9.538
+0.864
9.95%
jan 1, 2005
4.319
-5.219
-54.72%
jan 1, 2006
4.347
+0.028
0.65%
Ranking of countries by current statistics by years


Comments: