29
/
en
AIzaSyAYiBZKx7MnpbEhh9jyipgxe19OcubqV5w
April 1, 2024
203629
Mozambique
MOZ
true
2
1
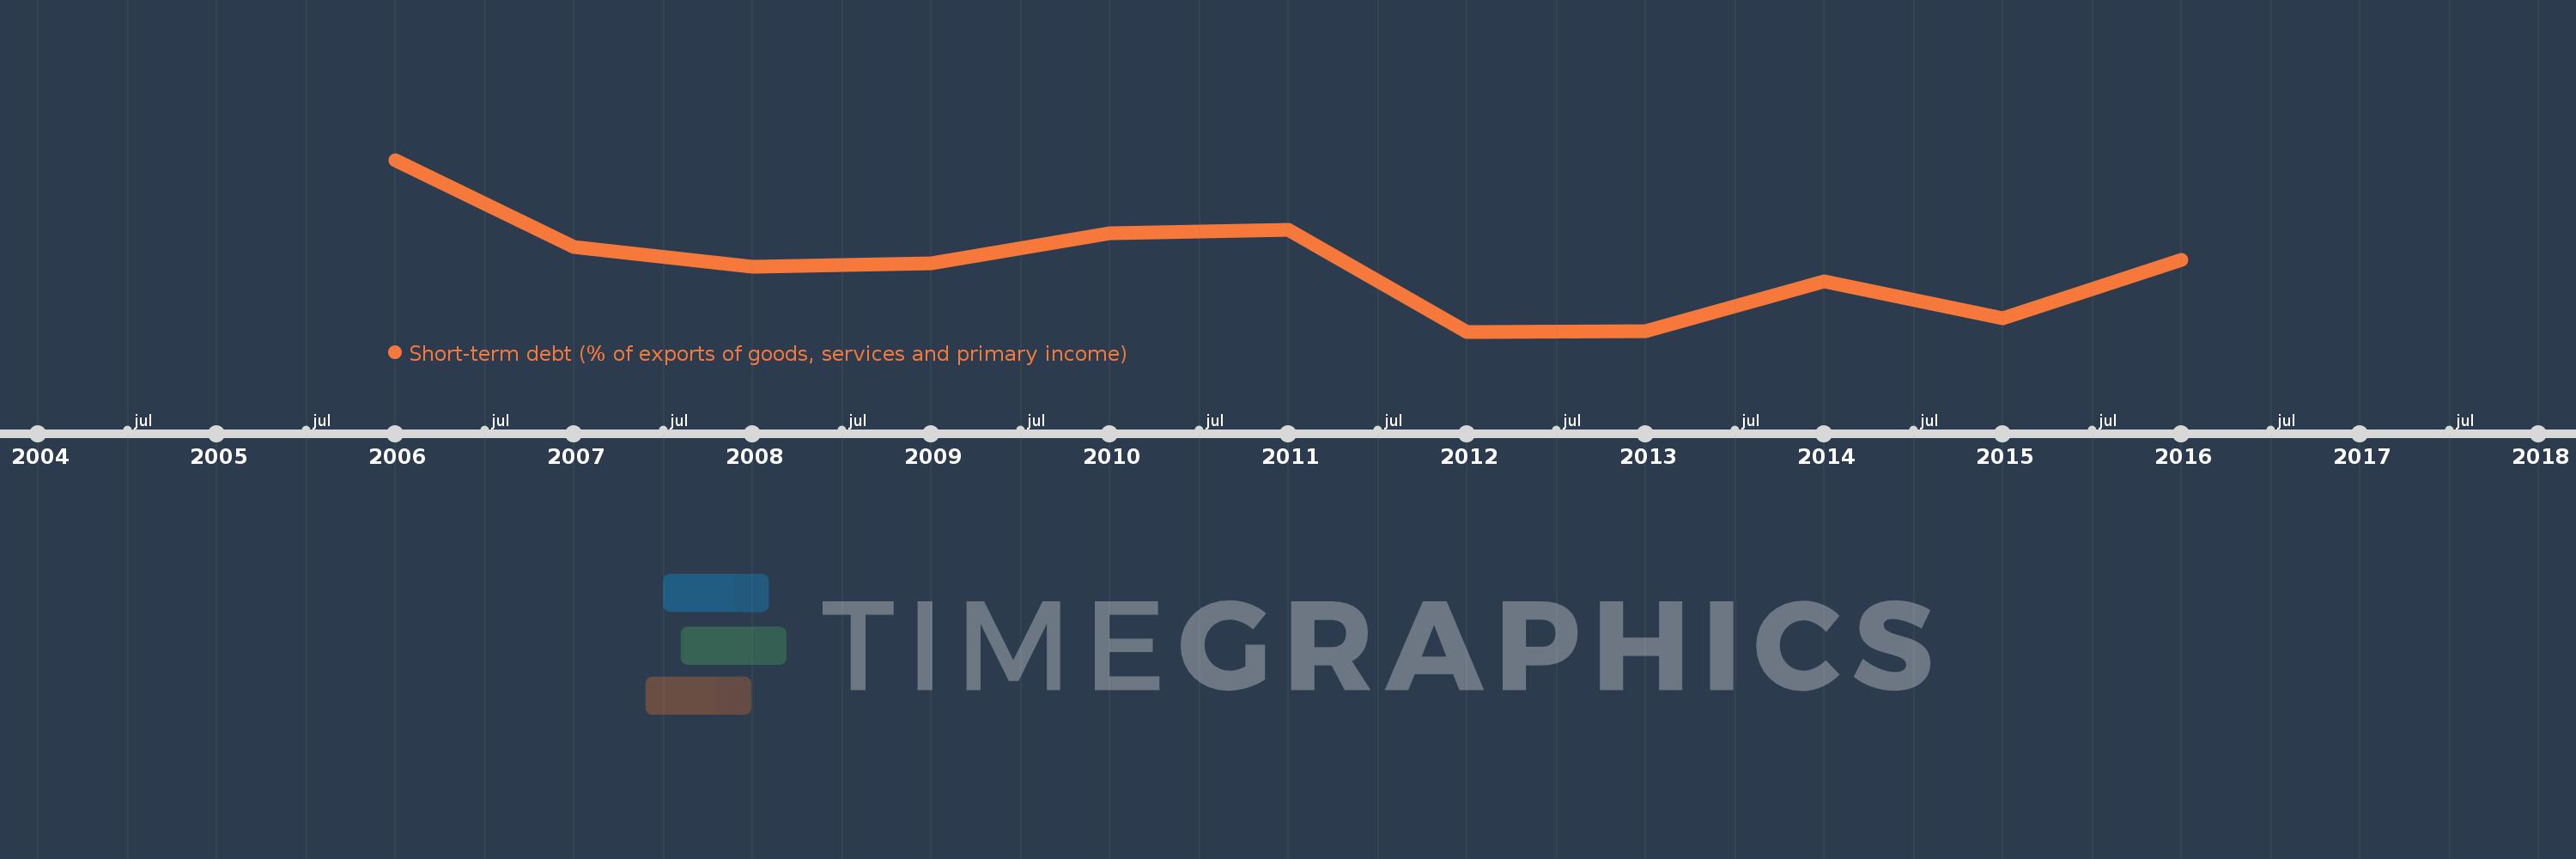
Short-term debt (% of exports of goods, services and primary income)
2016,2015,2014,2013,2012,2011,2010,2009,2008,2007,2006
This statistics in other country:
Timeline:
This timeline shows a graph from 2006 to 2016 of Mozambique. No data until 2005. Number of actual observations by date: 11.
Source name:
World Development Indicators
Source organization:
World Bank, International Debt Statistics.
Categories, topics:
Economy & Growth, External Debt
Last updated:
apr 23, 2017
Indicators value changes by year
Maximum:
32.664
jan 1, 2006
At the date of observation
Value
Absolute change
Change from previous value
jan 1, 2006
32.664
+32.664
0.0%
jan 1, 2007
19.672
-12.991
-39.77%
jan 1, 2008
16.837
-2.836
-14.41%
jan 1, 2009
17.248
+0.411
2.44%
jan 1, 2010
21.727
+4.479
25.97%
jan 1, 2011
22.242
+0.515
2.37%
jan 1, 2012
7.146
-15.095
-67.87%
jan 1, 2013
7.204
+0.058
0.81%
jan 1, 2014
14.668
+7.464
103.61%
jan 1, 2015
9.183
-5.485
-37.39%
jan 1, 2016
17.737
+8.554
93.14%
Ranking of countries by current statistics by years


Comments: