29
/
en
AIzaSyAYiBZKx7MnpbEhh9jyipgxe19OcubqV5w
April 1, 2024
49294
Middle East & North Africa (excluding high income)
MNA
false
2
1
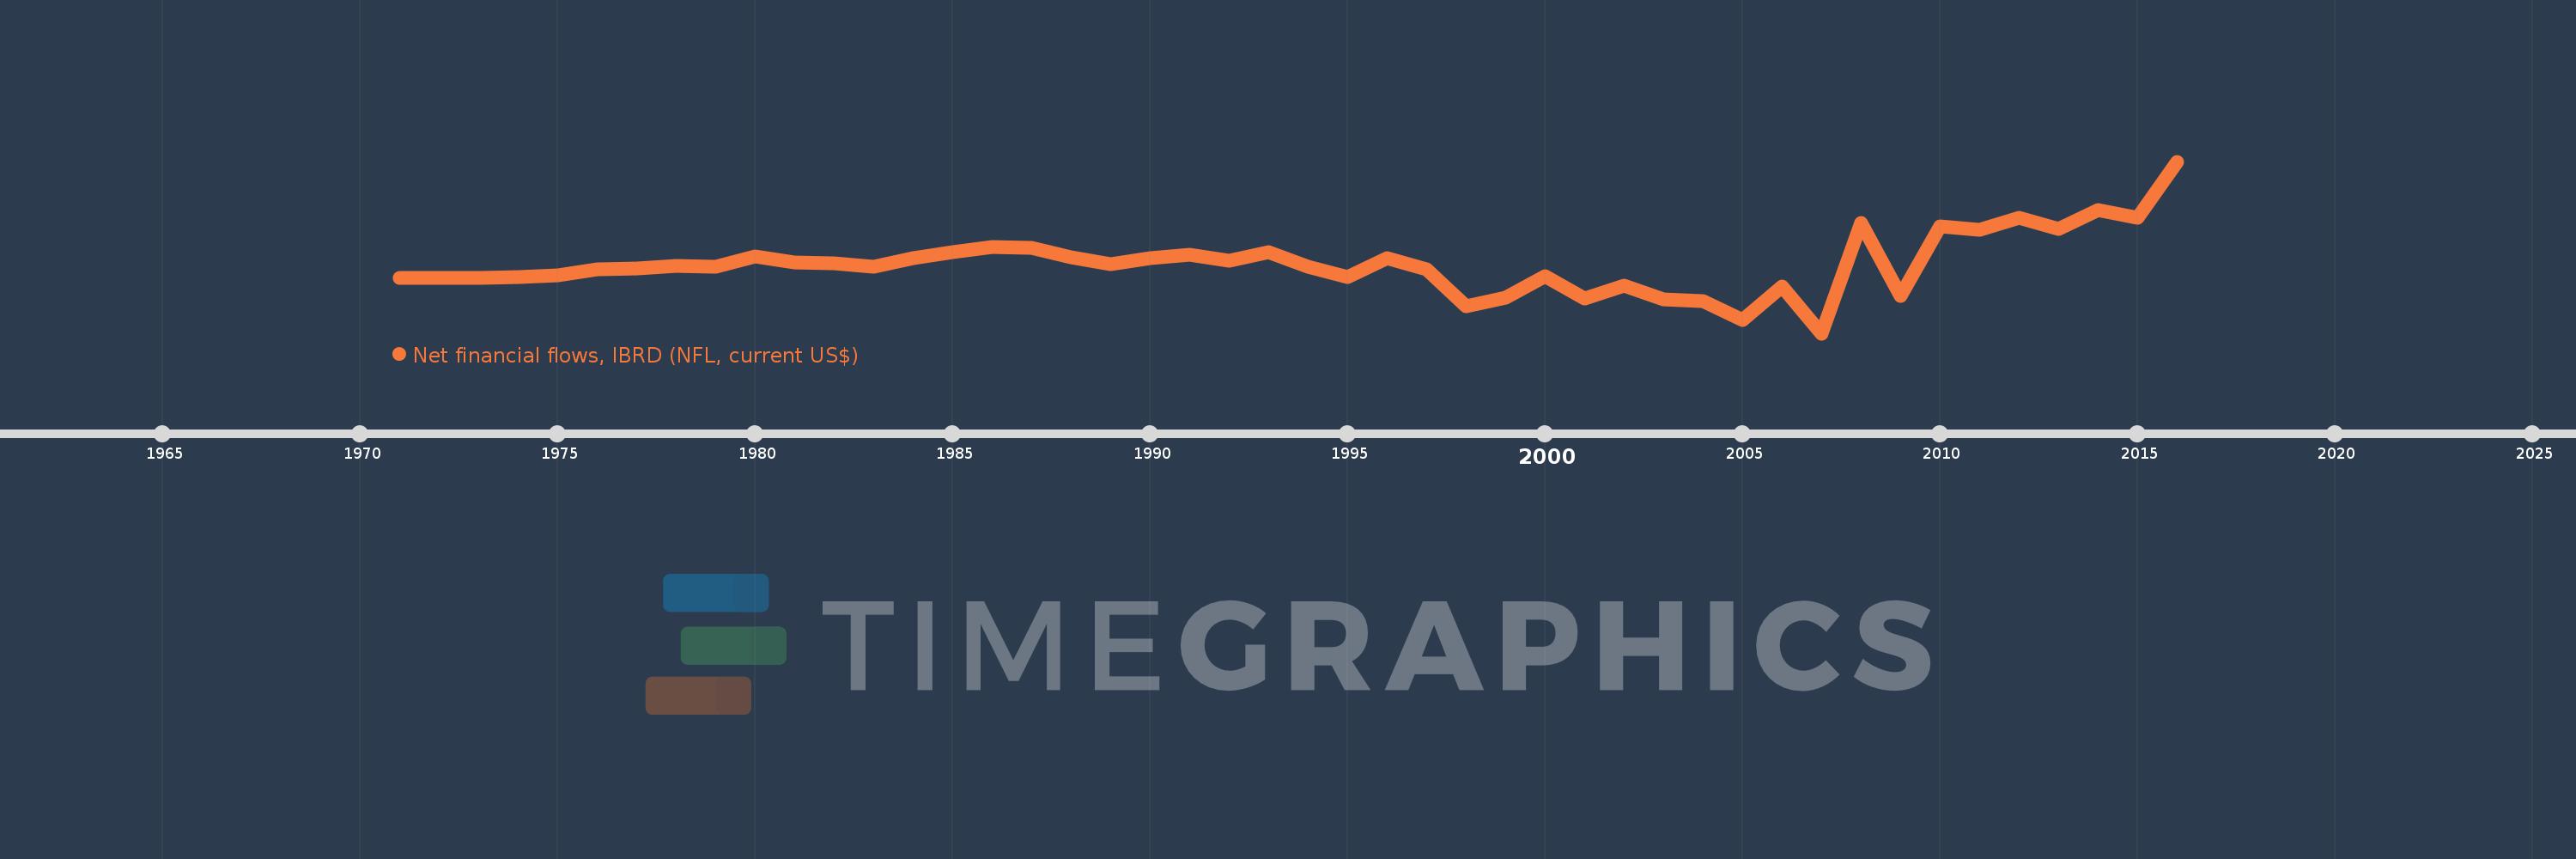
Net financial flows, IBRD (NFL, current US$)
2016,2015,2014,2013,2012,2011,2010,2009,2008,2007,2006,2005,2004,2003,2002,2001,2000,1999,1998,1997,1996,1995,1994,1993,1992,1991,1990,1989,1988,1987,1986,1985,1984,1983,1982,1981,1980,1979,1978,1977,1976,1975,1974,1973,1972,1971
This statistics in other country:
Timeline:
This timeline shows a graph from 1971 to 2016 of Middle East & North Africa (excluding high income). No data until 1970. Number of actual observations by date: 46.
Source name:
World Development Indicators
Source organization:
World Bank, International Debt Statistics.
Categories, topics:
External Debt
Last updated:
apr 23, 2017
Indicators value changes by year
Minimum:
-933.981 mln
jan 1, 2007
Maximum:
2.001 bln
jan 1, 2016
At the date of observation
Value
Absolute change
Change from previous value
jan 1, 1971
7.547 mln
+7.547 mln
0.0%
jan 1, 1972
18.229 mln
+10.682 mln
141.54%
jan 1, 1973
17.251 mln
-978.0K
-5.37%
jan 1, 1974
28.288 mln
+11.037 mln
63.98%
jan 1, 1975
56.241 mln
+27.953 mln
98.82%
jan 1, 1976
161.988 mln
+105.747 mln
188.02%
jan 1, 1977
167.133 mln
+5.145 mln
3.18%
jan 1, 1978
222.409 mln
+55.276 mln
33.07%
jan 1, 1979
209.931 mln
-12.478 mln
-5.61%
jan 1, 1980
377.469 mln
+167.538 mln
79.81%
jan 1, 1981
276.511 mln
-100.958 mln
-26.75%
jan 1, 1982
257.918 mln
-18.593 mln
-6.72%
jan 1, 1983
207.258 mln
-50.66 mln
-19.64%
jan 1, 1984
351.932 mln
+144.674 mln
69.8%
jan 1, 1985
452.37 mln
+100.438 mln
28.54%
jan 1, 1986
547.809 mln
+95.439 mln
21.1%
jan 1, 1987
524.668 mln
-23.141 mln
-4.22%
jan 1, 1988
368.438 mln
-156.23 mln
-29.78%
jan 1, 1989
252.546 mln
-115.892 mln
-31.45%
jan 1, 1990
343.783 mln
+91.237 mln
36.13%
jan 1, 1991
408.694 mln
+64.911 mln
18.88%
jan 1, 1992
298.982 mln
-109.712 mln
-26.84%
jan 1, 1993
450.924 mln
+151.942 mln
50.82%
jan 1, 1994
207.681 mln
-243.243 mln
-53.94%
jan 1, 1995
25.945 mln
-181.736 mln
-87.51%
jan 1, 1996
345.896 mln
+319.951 mln
1.23K%
jan 1, 1997
164.147 mln
-181.749 mln
-52.54%
jan 1, 1998
-473.947 mln
-638.094 mln
-388.73%
jan 1, 1999
-321.384 mln
+152.563 mln
-32.19%
jan 1, 2000
49.198 mln
+370.582 mln
-115.31%
jan 1, 2001
-336.332 mln
-385.53 mln
-783.63%
jan 1, 2002
-123.343 mln
+212.989 mln
-63.33%
jan 1, 2003
-351.434 mln
-228.091 mln
184.92%
jan 1, 2004
-381.167 mln
-29.733 mln
8.46%
jan 1, 2005
-709.236 mln
-328.069 mln
86.07%
jan 1, 2006
-135.496 mln
+573.74 mln
-80.9%
jan 1, 2007
-933.981 mln
-798.485 mln
589.31%
jan 1, 2008
952.025 mln
+1.886 bln
-201.93%
jan 1, 2009
-302.842 mln
-1.255 bln
-131.81%
jan 1, 2010
894.213 mln
+1.197 bln
-395.27%
jan 1, 2011
837.331 mln
-56.882 mln
-6.36%
jan 1, 2012
1.034 bln
+196.415 mln
23.46%
jan 1, 2013
845.63 mln
-188.116 mln
-18.2%
jan 1, 2014
1.178 bln
+332.772 mln
39.35%
jan 1, 2015
1.034 bln
-143.958 mln
-12.22%
jan 1, 2016
2.001 bln
+966.956 mln
93.48%
Ranking of countries by current statistics by years


Comments: