29
/
en
AIzaSyAYiBZKx7MnpbEhh9jyipgxe19OcubqV5w
April 1, 2024
170274
Korea, Rep.
KOR
true
2
1
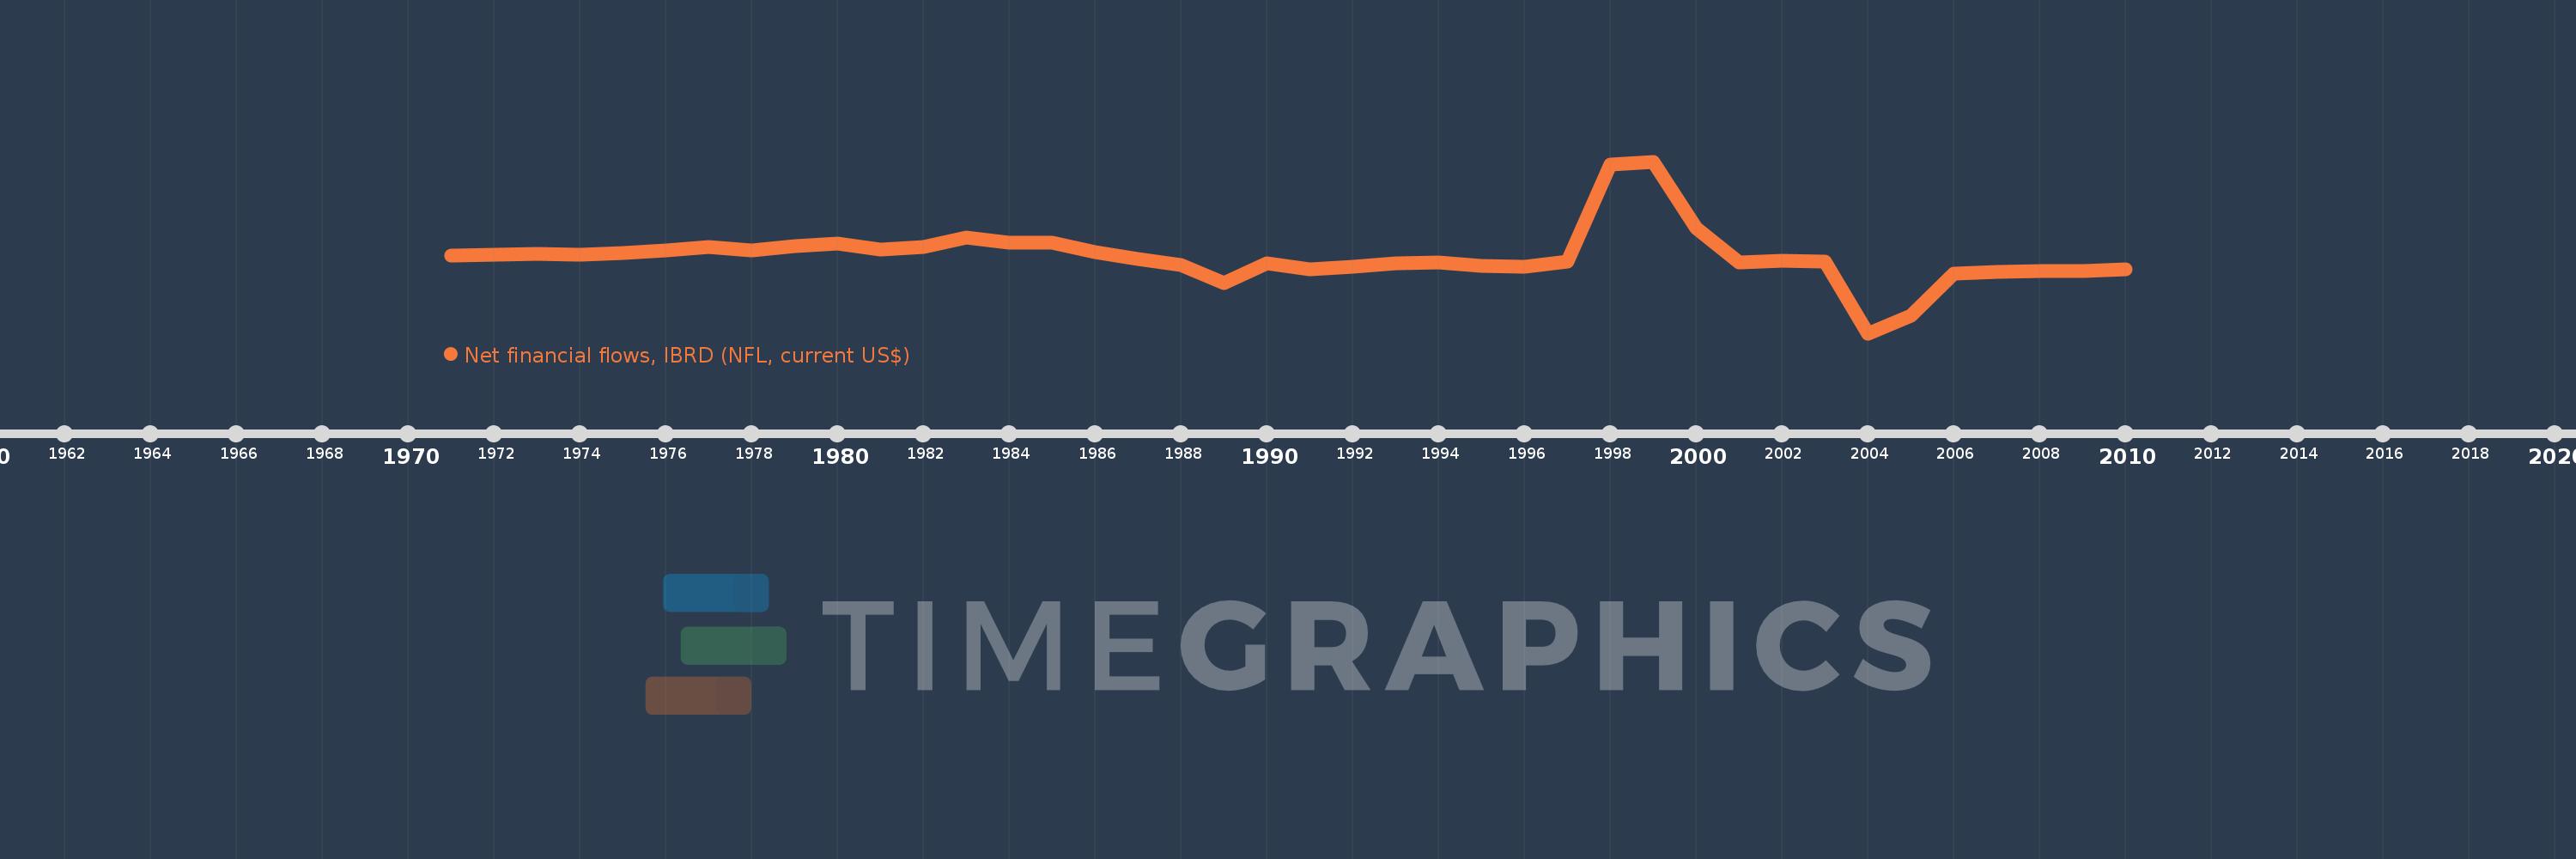
Net financial flows, IBRD (NFL, current US$)
2010,2009,2008,2007,2006,2005,2004,2003,2002,2001,2000,1999,1998,1997,1996,1995,1994,1993,1992,1991,1990,1989,1988,1987,1986,1985,1984,1983,1982,1981,1980,1979,1978,1977,1976,1975,1974,1973,1972,1971
This statistics in other country:
Timeline:
This timeline shows a graph from 1971 to 2010 of Korea, Rep.. No data until 1970. Number of actual observations by date: 40.
Source name:
World Development Indicators
Source organization:
World Bank, International Debt Statistics.
Categories, topics:
External Debt
Last updated:
apr 23, 2017
Indicators value changes by year
Minimum:
-2.355 bln
jan 1, 2004
Maximum:
2.879 bln
jan 1, 1999
At the date of observation
Value
Absolute change
Change from previous value
jan 1, 1971
7.2 mln
+7.2 mln
0.0%
jan 1, 1972
30.9 mln
+23.7 mln
329.17%
jan 1, 1973
55.9 mln
+25.0 mln
80.91%
jan 1, 1974
44.6 mln
-11.3 mln
-20.21%
jan 1, 1975
81.0 mln
+36.4 mln
81.61%
jan 1, 1976
181.6 mln
+100.6 mln
124.2%
jan 1, 1977
273.4 mln
+91.8 mln
50.55%
jan 1, 1978
172.2 mln
-101.2 mln
-37.02%
jan 1, 1979
294.9 mln
+122.7 mln
71.25%
jan 1, 1980
390.1 mln
+95.2 mln
32.28%
jan 1, 1981
187.8 mln
-202.3 mln
-51.86%
jan 1, 1982
264.3 mln
+76.5 mln
40.73%
jan 1, 1983
560.8 mln
+296.5 mln
112.18%
jan 1, 1984
410.2 mln
-150.6 mln
-26.85%
jan 1, 1985
394.6 mln
-15.6 mln
-3.8%
jan 1, 1986
111.591 mln
-283.009 mln
-71.72%
jan 1, 1987
-102.382 mln
-213.973 mln
-191.75%
jan 1, 1988
-279.65 mln
-177.268 mln
173.14%
jan 1, 1989
-814.646 mln
-534.996 mln
191.31%
jan 1, 1990
-215.399 mln
+599.247 mln
-73.56%
jan 1, 1991
-402.48 mln
-187.081 mln
86.85%
jan 1, 1992
-331.174 mln
+71.306 mln
-17.72%
jan 1, 1993
-216.682 mln
+114.492 mln
-34.57%
jan 1, 1994
-188.285 mln
+28.397 mln
-13.11%
jan 1, 1995
-306.066 mln
-117.781 mln
62.55%
jan 1, 1996
-316.608 mln
-10.543 mln
3.44%
jan 1, 1997
-175.576 mln
+141.033 mln
-44.54%
jan 1, 1998
2.798 bln
+2.973 bln
-1.69K%
jan 1, 1999
2.879 bln
+81.105 mln
2.9%
jan 1, 2000
843.584 mln
-2.035 bln
-70.7%
jan 1, 2001
-187.621 mln
-1.031 bln
-122.24%
jan 1, 2002
-140.158 mln
+47.463 mln
-25.3%
jan 1, 2003
-157.117 mln
-16.959 mln
12.1%
jan 1, 2004
-2.355 bln
-2.198 bln
1.4K%
jan 1, 2005
-1.807 bln
+548.124 mln
-23.28%
jan 1, 2006
-531.173 mln
+1.276 bln
-70.6%
jan 1, 2007
-483.715 mln
+47.458 mln
-8.93%
jan 1, 2008
-469.795 mln
+13.92 mln
-2.88%
jan 1, 2009
-457.977 mln
+11.818 mln
-2.52%
jan 1, 2010
-415.996 mln
+41.981 mln
-9.17%
Ranking of countries by current statistics by years


Comments: