29
/
en
AIzaSyAYiBZKx7MnpbEhh9jyipgxe19OcubqV5w
April 1, 2024
87608
Bolivia
BOL
true
2
1
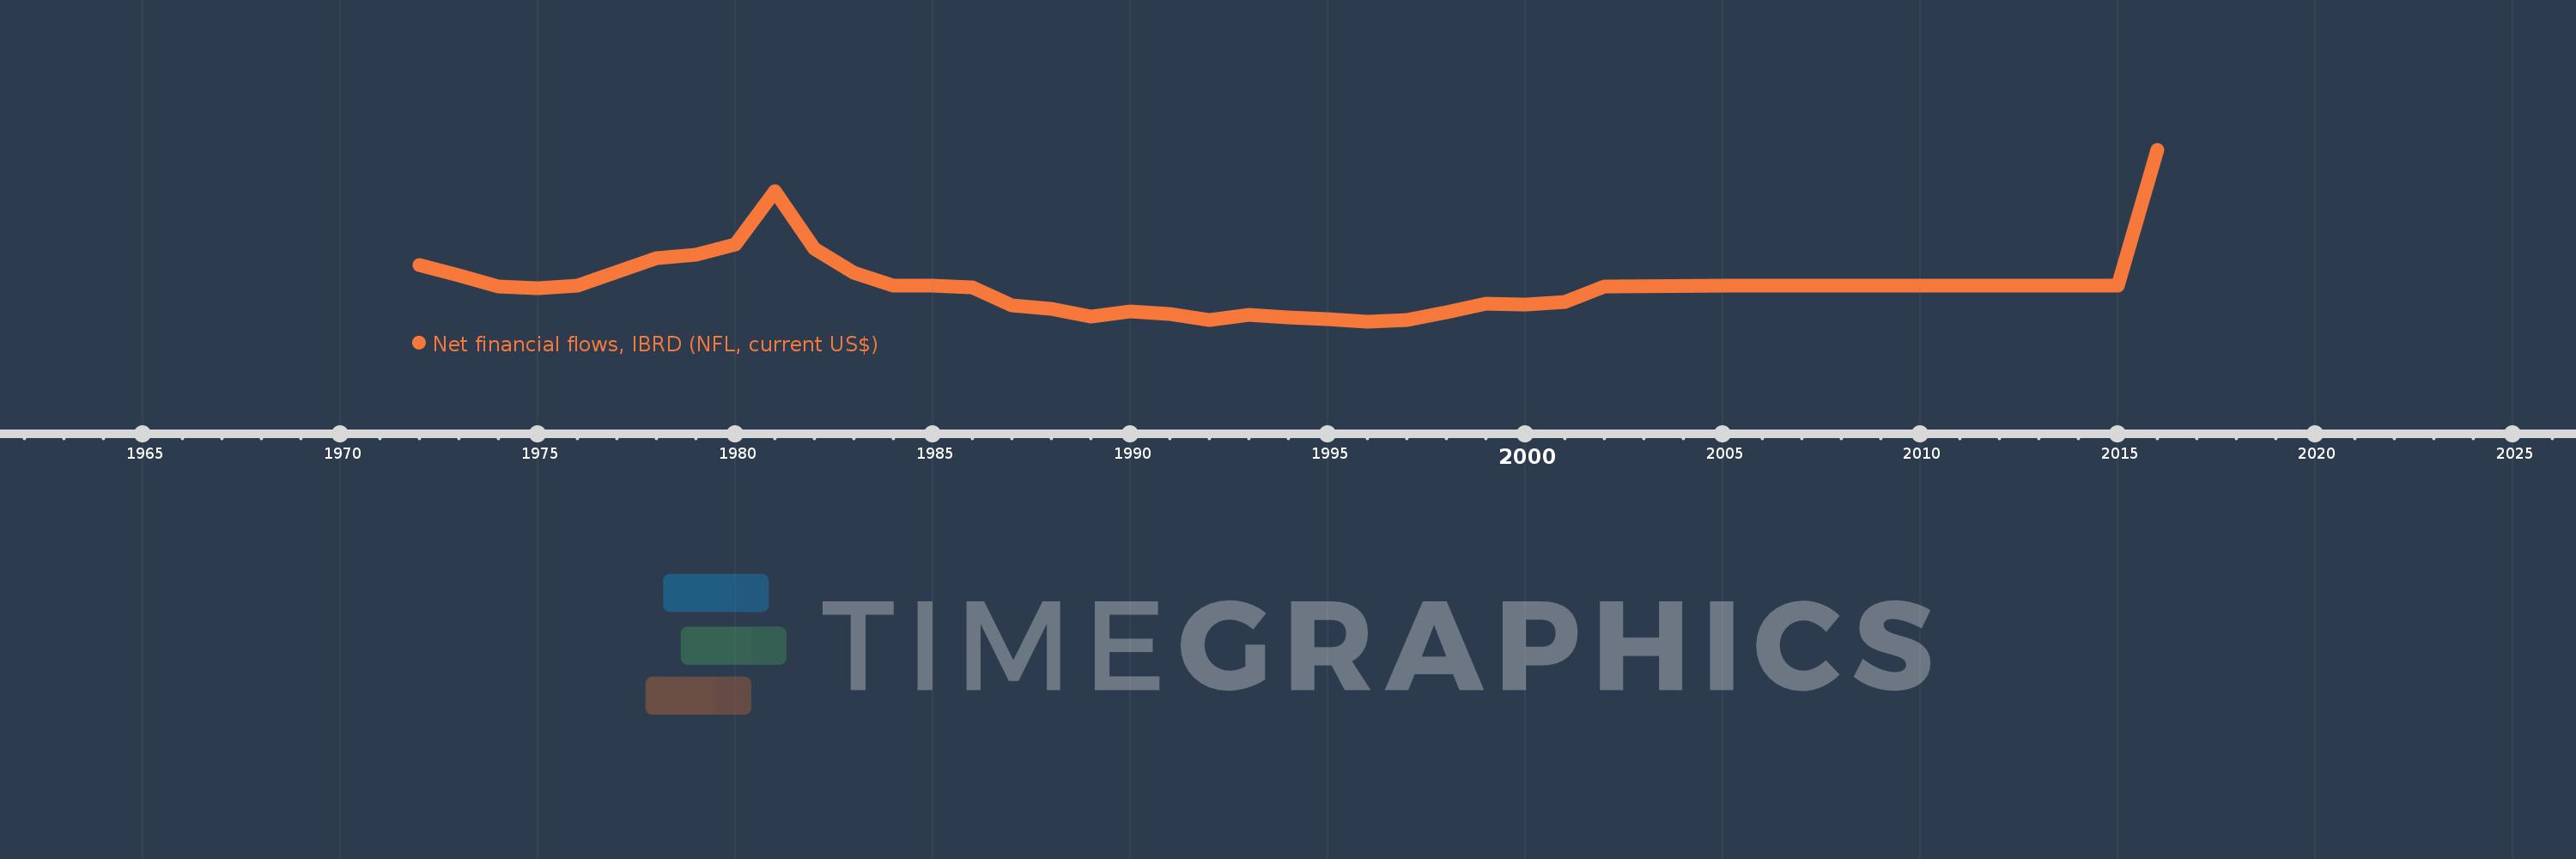
Net financial flows, IBRD (NFL, current US$)
2016,2015,2014,2013,2012,2011,2010,2009,2008,2007,2006,2005,2002,2001,2000,1999,1998,1997,1996,1995,1994,1993,1992,1991,1990,1989,1988,1987,1986,1985,1984,1983,1982,1981,1980,1979,1978,1977,1976,1975,1974,1973,1972
This statistics in other country:
Timeline:
This timeline shows a graph from 1972 to 2016 of Bolivia. No data until 1971. Number of actual observations by date: 43.
Source name:
World Development Indicators
Source organization:
World Bank, International Debt Statistics.
Categories, topics:
External Debt
Last updated:
apr 23, 2017
Indicators value changes by year
Minimum:
-26.499 mln
jan 1, 1996
Maximum:
99.992 mln
jan 1, 2016
At the date of observation
Value
Absolute change
Change from previous value
jan 1, 1972
15.315 mln
+15.315 mln
0.0%
jan 1, 1973
7.694 mln
-7.621 mln
-49.76%
jan 1, 1974
-387.0K
-8.081 mln
-105.03%
jan 1, 1975
-1.884 mln
-1.497 mln
386.82%
jan 1, 1976
198.0K
+2.082 mln
-110.51%
jan 1, 1977
10.371 mln
+10.173 mln
5.14K%
jan 1, 1978
20.345 mln
+9.974 mln
96.17%
jan 1, 1979
22.799 mln
+2.454 mln
12.06%
jan 1, 1980
30.844 mln
+8.045 mln
35.29%
jan 1, 1981
70.013 mln
+39.169 mln
126.99%
jan 1, 1982
27.383 mln
-42.63 mln
-60.89%
jan 1, 1983
9.492 mln
-17.891 mln
-65.34%
jan 1, 1984
537.0K
-8.955 mln
-94.34%
jan 1, 1985
161.0K
-376.0K
-70.02%
jan 1, 1986
-1.164 mln
-1.325 mln
-822.98%
jan 1, 1987
-14.566 mln
-13.402 mln
1.15K%
jan 1, 1988
-16.643 mln
-2.077 mln
14.26%
jan 1, 1989
-22.664 mln
-6.021 mln
36.18%
jan 1, 1990
-18.796 mln
+3.868 mln
-17.07%
jan 1, 1991
-20.905 mln
-2.109 mln
11.22%
jan 1, 1992
-25.32 mln
-4.415 mln
21.12%
jan 1, 1993
-21.544 mln
+3.776 mln
-14.91%
jan 1, 1994
-23.072 mln
-1.528 mln
7.09%
jan 1, 1995
-24.177 mln
-1.105 mln
4.79%
jan 1, 1996
-26.499 mln
-2.322 mln
9.6%
jan 1, 1997
-25.354 mln
+1.145 mln
-4.32%
jan 1, 1998
-19.444 mln
+5.91 mln
-23.31%
jan 1, 1999
-12.772 mln
+6.672 mln
-34.31%
jan 1, 2000
-13.451 mln
-679.0K
5.32%
jan 1, 2001
-11.895 mln
+1.556 mln
-11.57%
jan 1, 2002
-243.0K
+11.652 mln
-97.96%
jan 1, 2005
150.0K
+393.0K
-161.73%
jan 1, 2006
0.0
-150.0K
-100.0%
jan 1, 2011
-8.0K
0.0
0.0%
jan 1, 2012
-8.0K
0.0
0.0%
jan 1, 2013
-8.0K
0.0
0.0%
jan 1, 2014
-8.0K
0.0
0.0%
jan 1, 2015
-8.0K
0.0
0.0%
jan 1, 2016
99.992 mln
+100.0 mln
-1.25 mln%
Ranking of countries by current statistics by years


Comments: