29
/
en
AIzaSyAYiBZKx7MnpbEhh9jyipgxe19OcubqV5w
April 1, 2024
152864
Hungary
HUN
true
2
1
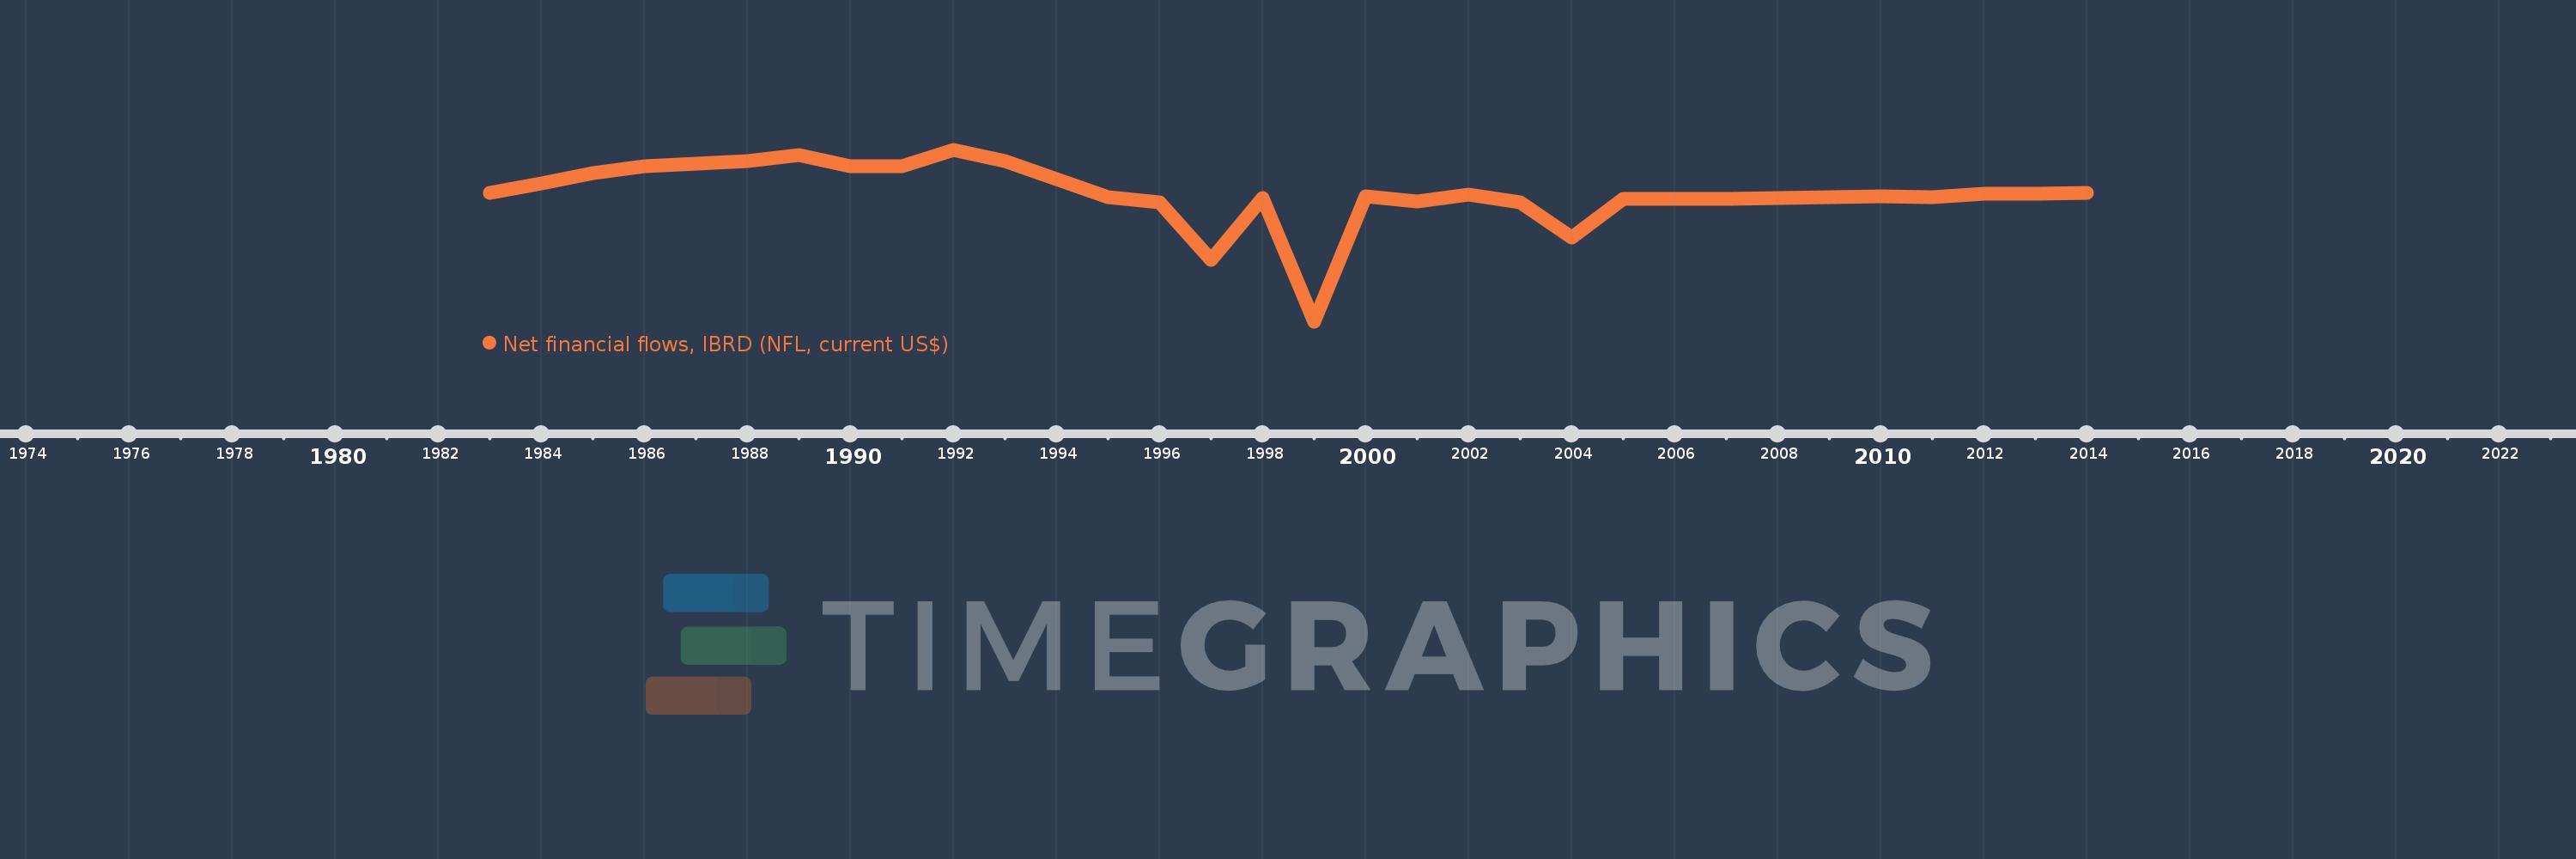
Net financial flows, IBRD (NFL, current US$)
2014,2013,2012,2011,2010,2009,2008,2007,2006,2005,2004,2003,2002,2001,2000,1999,1998,1997,1996,1995,1994,1993,1992,1991,1990,1989,1988,1987,1986,1985,1984,1983
This statistics in other country:
Timeline:
This timeline shows a graph from 1983 to 2014 of Hungary. No data until 1982. Number of actual observations by date: 32.
Source name:
World Development Indicators
Source organization:
World Bank, International Debt Statistics.
Categories, topics:
External Debt
Last updated:
apr 23, 2017
Indicators value changes by year
Minimum:
-802.344 mln
jan 1, 1999
Maximum:
262.292 mln
jan 1, 1992
At the date of observation
Value
Absolute change
Change from previous value
jan 1, 1984
57.193 mln
+57.193 mln
%
jan 1, 1985
120.587 mln
+63.394 mln
110.84%
jan 1, 1986
161.627 mln
+41.04 mln
34.03%
jan 1, 1987
179.987 mln
+18.36 mln
11.36%
jan 1, 1988
194.737 mln
+14.75 mln
8.2%
jan 1, 1989
234.22 mln
+39.483 mln
20.28%
jan 1, 1990
164.008 mln
-70.212 mln
-29.98%
jan 1, 1991
160.469 mln
-3.539 mln
-2.16%
jan 1, 1992
262.292 mln
+101.823 mln
63.45%
jan 1, 1993
192.844 mln
-69.448 mln
-26.48%
jan 1, 1994
84.638 mln
-108.206 mln
-56.11%
jan 1, 1995
-28.119 mln
-112.757 mln
-133.22%
jan 1, 1996
-63.168 mln
-35.049 mln
124.65%
jan 1, 1997
-419.017 mln
-355.849 mln
563.34%
jan 1, 1998
-32.827 mln
+386.19 mln
-92.17%
jan 1, 1999
-802.344 mln
-769.517 mln
2.34K%
jan 1, 2000
-23.568 mln
+778.776 mln
-97.06%
jan 1, 2001
-56.666 mln
-33.098 mln
140.44%
jan 1, 2002
-10.321 mln
+46.345 mln
-81.79%
jan 1, 2003
-62.913 mln
-52.592 mln
509.56%
jan 1, 2004
-280.468 mln
-217.555 mln
345.8%
jan 1, 2005
-39.497 mln
+240.971 mln
-85.92%
jan 1, 2006
-39.534 mln
-37.0K
0.09%
jan 1, 2007
-39.021 mln
+513.0K
-1.3%
jan 1, 2008
-36.622 mln
+2.399 mln
-6.15%
jan 1, 2009
-29.792 mln
+6.83 mln
-18.65%
jan 1, 2010
-23.085 mln
+6.707 mln
-22.51%
jan 1, 2011
-26.439 mln
-3.354 mln
14.53%
jan 1, 2012
-9.38 mln
+17.059 mln
-64.52%
jan 1, 2013
-6.426 mln
+2.954 mln
-31.49%
jan 1, 2014
-4.093 mln
+2.333 mln
-36.31%
Ranking of countries by current statistics by years


Comments: