29
/
en
AIzaSyAYiBZKx7MnpbEhh9jyipgxe19OcubqV5w
April 1, 2024
222566
Peru
PER
true
2
1
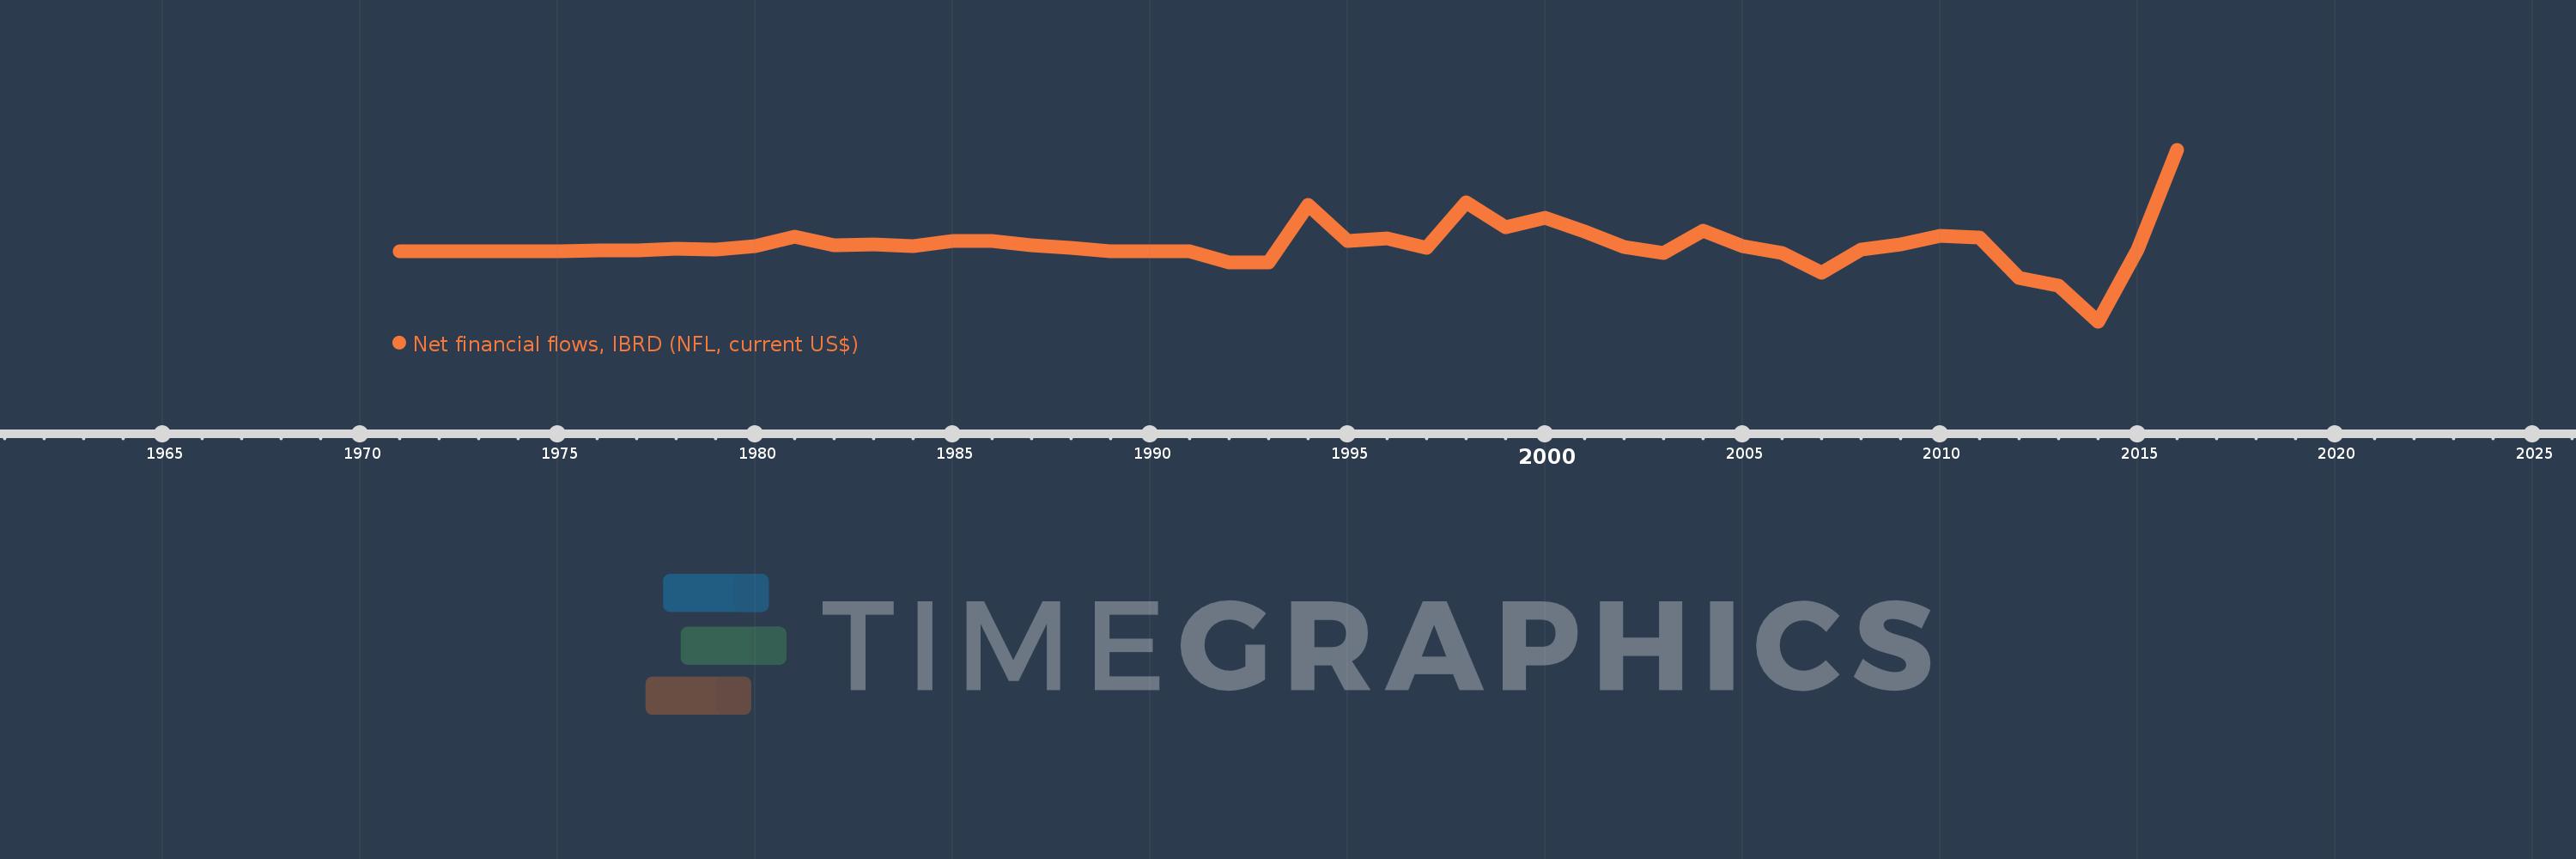
Net financial flows, IBRD (NFL, current US$)
2016,2015,2014,2013,2012,2011,2010,2009,2008,2007,2006,2005,2004,2003,2002,2001,2000,1999,1998,1997,1996,1995,1994,1993,1992,1991,1989,1988,1987,1986,1985,1984,1983,1982,1981,1980,1979,1978,1977,1976,1975,1974,1973,1972,1971
This statistics in other country:
Timeline:
This timeline shows a graph from 1971 to 2016 of Peru. No data until 1970. Number of actual observations by date: 45.
Source name:
World Development Indicators
Source organization:
World Bank, International Debt Statistics.
Categories, topics:
External Debt
Last updated:
apr 23, 2017
Indicators value changes by year
Minimum:
-611.14 mln
jan 1, 2014
Maximum:
876.62 mln
jan 1, 2016
At the date of observation
Value
Absolute change
Change from previous value
jan 1, 1971
2.279 mln
+2.279 mln
0.0%
jan 1, 1972
4.637 mln
+2.358 mln
103.47%
jan 1, 1973
2.043 mln
-2.594 mln
-55.94%
jan 1, 1974
392.0K
-1.651 mln
-80.81%
jan 1, 1975
1000.0
-391.0K
-99.74%
jan 1, 1976
6.518 mln
+6.517 mln
651.7K%
jan 1, 1977
10.195 mln
+3.677 mln
56.41%
jan 1, 1978
22.977 mln
+12.782 mln
125.38%
jan 1, 1979
14.661 mln
-8.316 mln
-36.19%
jan 1, 1980
49.012 mln
+34.351 mln
234.3%
jan 1, 1981
124.752 mln
+75.74 mln
154.53%
jan 1, 1982
56.523 mln
-68.229 mln
-54.69%
jan 1, 1983
62.139 mln
+5.616 mln
9.94%
jan 1, 1984
48.798 mln
-13.341 mln
-21.47%
jan 1, 1985
90.107 mln
+41.309 mln
84.65%
jan 1, 1986
91.179 mln
+1.072 mln
1.19%
jan 1, 1987
53.07 mln
-38.109 mln
-41.8%
jan 1, 1988
31.862 mln
-21.208 mln
-39.96%
jan 1, 1989
1.753 mln
-30.109 mln
-94.5%
jan 1, 1991
-5.0K
-1.758 mln
-100.29%
jan 1, 1992
-94.447 mln
-94.442 mln
1.89 mln%
jan 1, 1993
-93.965 mln
+482.0K
-0.51%
jan 1, 1994
401.115 mln
+495.08 mln
-526.88%
jan 1, 1995
90.677 mln
-310.438 mln
-77.39%
jan 1, 1996
116.371 mln
+25.694 mln
28.34%
jan 1, 1997
29.309 mln
-87.062 mln
-74.81%
jan 1, 1998
424.989 mln
+395.68 mln
1.35K%
jan 1, 1999
207.06 mln
-217.929 mln
-51.28%
jan 1, 2000
290.907 mln
+83.847 mln
40.49%
jan 1, 2001
172.918 mln
-117.989 mln
-40.56%
jan 1, 2002
35.418 mln
-137.5 mln
-79.52%
jan 1, 2003
-16.826 mln
-52.244 mln
-147.51%
jan 1, 2004
180.366 mln
+197.192 mln
-1.17K%
jan 1, 2005
45.445 mln
-134.921 mln
-74.8%
jan 1, 2006
-17.328 mln
-62.773 mln
-138.13%
jan 1, 2007
-182.509 mln
-165.181 mln
953.26%
jan 1, 2008
15.254 mln
+197.763 mln
-108.36%
jan 1, 2009
63.166 mln
+47.912 mln
314.09%
jan 1, 2010
134.363 mln
+71.197 mln
112.71%
jan 1, 2011
118.944 mln
-15.419 mln
-11.48%
jan 1, 2012
-232.215 mln
-351.159 mln
-295.23%
jan 1, 2013
-297.816 mln
-65.601 mln
28.25%
jan 1, 2014
-611.14 mln
-313.324 mln
105.21%
jan 1, 2015
17.15 mln
+628.29 mln
-102.81%
jan 1, 2016
876.62 mln
+859.47 mln
5.01K%
Ranking of countries by current statistics by years


Comments: