29
/
en
AIzaSyAYiBZKx7MnpbEhh9jyipgxe19OcubqV5w
April 1, 2024
193366
Mauritania
MRT
true
2
1
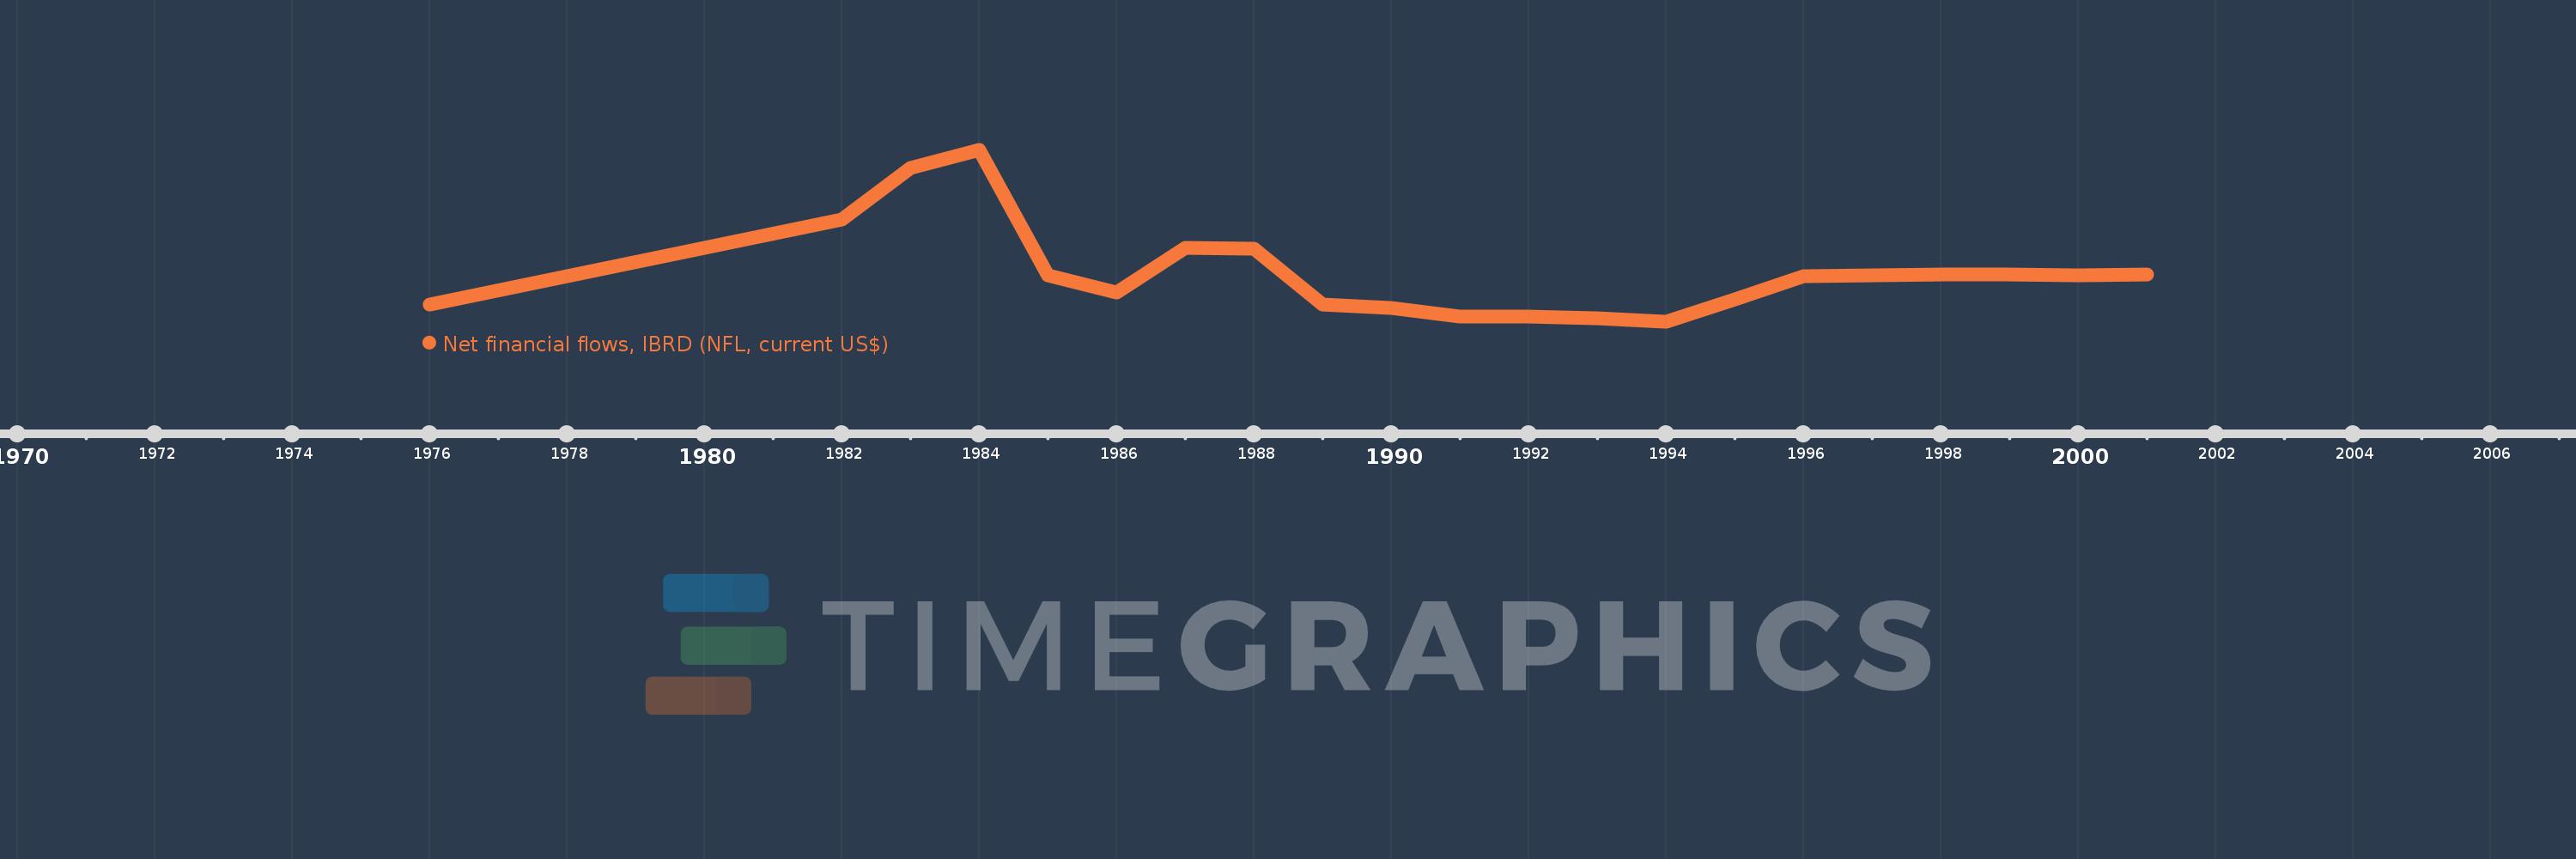
Net financial flows, IBRD (NFL, current US$)
2001,2000,1999,1998,1997,1996,1995,1994,1993,1992,1991,1990,1989,1988,1987,1986,1985,1984,1983,1982,1976
This statistics in other country:
Timeline:
This timeline shows a graph from 1976 to 2001 of Mauritania. No data until 1975. Number of actual observations by date: 21.
Source name:
World Development Indicators
Source organization:
World Bank, International Debt Statistics.
Categories, topics:
External Debt
Last updated:
apr 23, 2017
Indicators value changes by year
Minimum:
-12.644 mln
jan 1, 1994
Maximum:
26.346 mln
jan 1, 1984
At the date of observation
Value
Absolute change
Change from previous value
jan 1, 1976
-8.65 mln
-8.65 mln
0.0%
jan 1, 1982
10.519 mln
+19.169 mln
-221.61%
jan 1, 1983
22.294 mln
+11.775 mln
111.94%
jan 1, 1984
26.346 mln
+4.052 mln
18.18%
jan 1, 1985
-2.08 mln
-28.426 mln
-107.89%
jan 1, 1986
-5.974 mln
-3.894 mln
187.21%
jan 1, 1987
4.151 mln
+10.125 mln
-169.48%
jan 1, 1988
3.933 mln
-218.0K
-5.25%
jan 1, 1989
-8.755 mln
-12.688 mln
-322.6%
jan 1, 1990
-9.556 mln
-801.0K
9.15%
jan 1, 1991
-11.339 mln
-1.783 mln
18.66%
jan 1, 1992
-11.355 mln
-16.0K
0.14%
jan 1, 1993
-11.855 mln
-500.0K
4.4%
jan 1, 1994
-12.644 mln
-789.0K
6.66%
jan 1, 1995
-7.48 mln
+5.164 mln
-40.84%
jan 1, 1996
-2.312 mln
+5.168 mln
-69.09%
jan 1, 1997
-2.099 mln
+213.0K
-9.21%
jan 1, 1998
-1.91 mln
+189.0K
-9.0%
jan 1, 1999
-1.844 mln
+66.0K
-3.46%
jan 1, 2000
-2.005 mln
-161.0K
8.73%
jan 1, 2001
-1.85 mln
+155.0K
-7.73%
Ranking of countries by current statistics by years


Comments: