29
/
en
AIzaSyAYiBZKx7MnpbEhh9jyipgxe19OcubqV5w
April 1, 2024
167864
Kenya
KEN
true
2
1
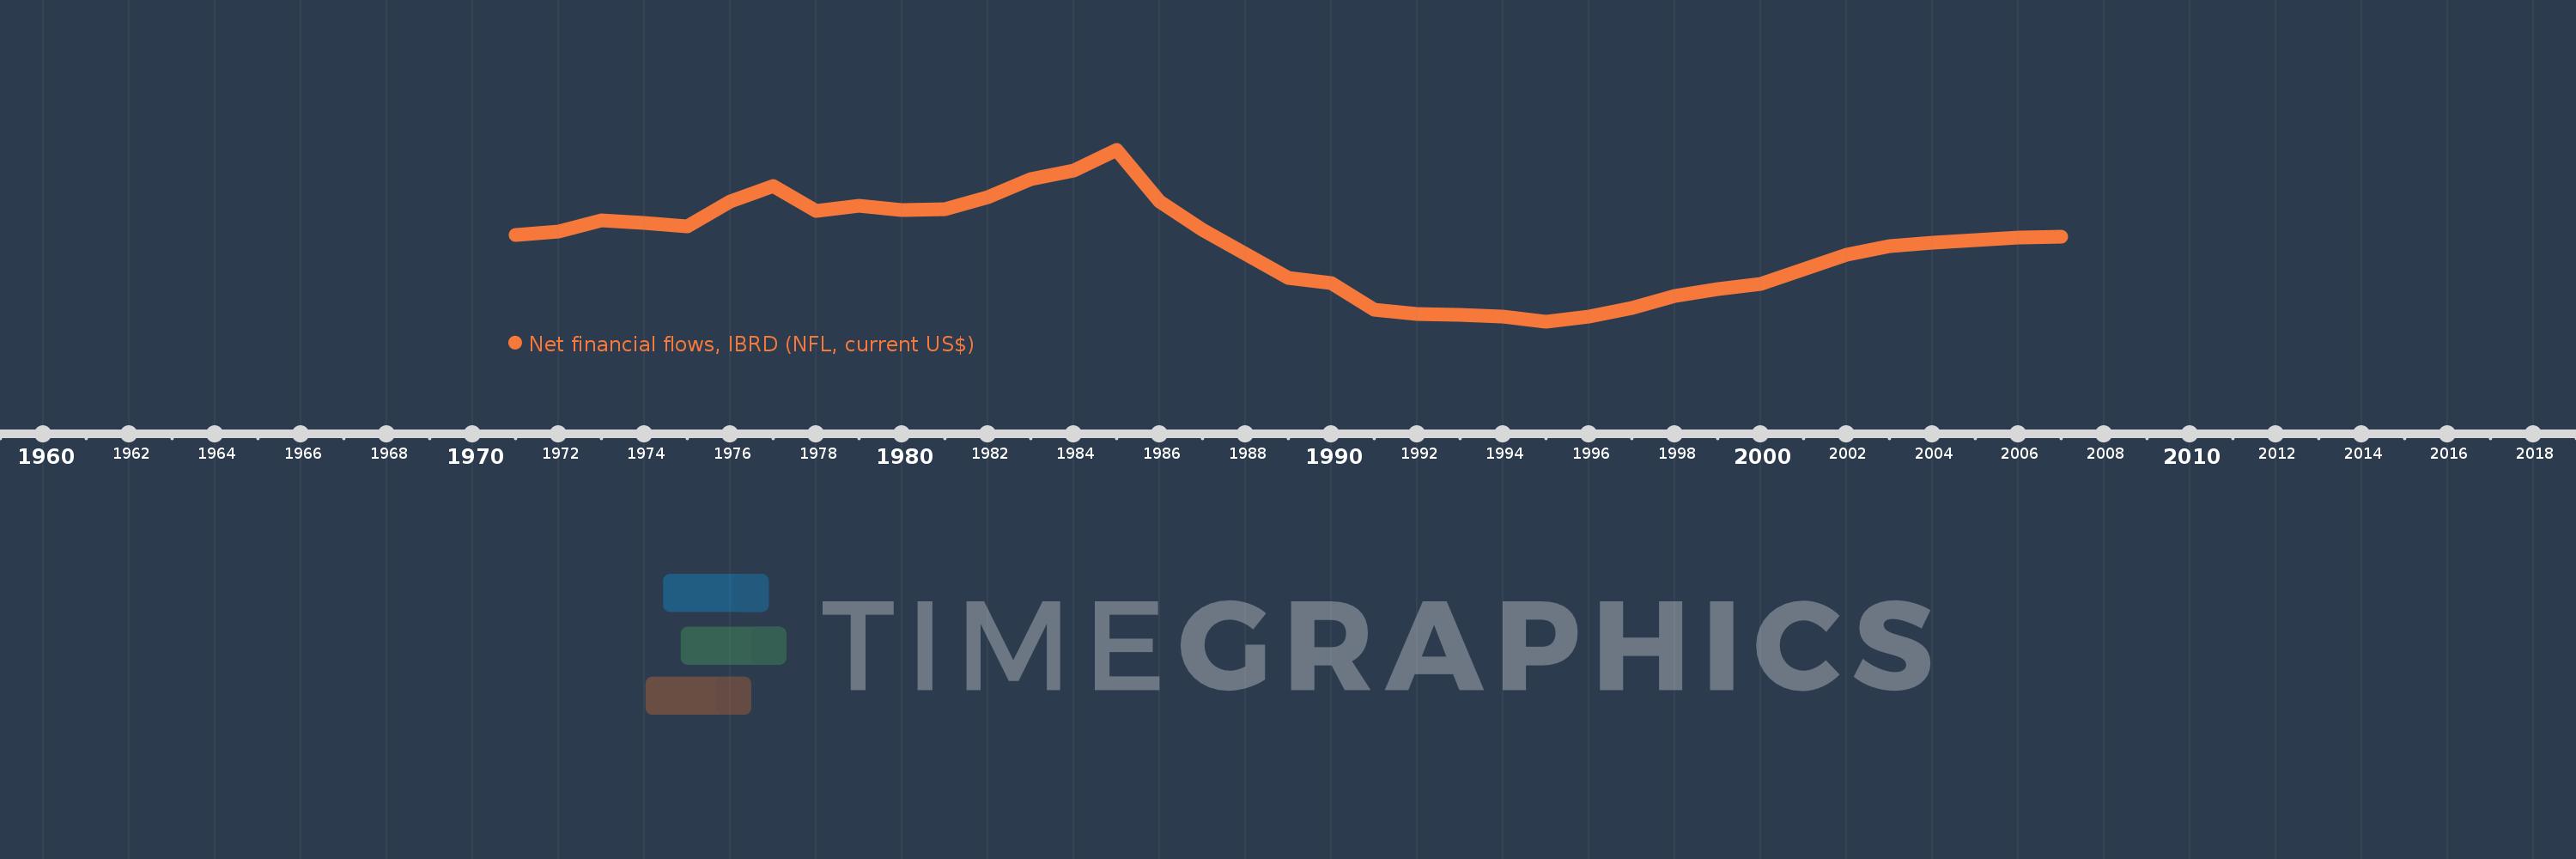
Net financial flows, IBRD (NFL, current US$)
2007,2006,2005,2004,2003,2002,2001,2000,1999,1998,1997,1996,1995,1994,1993,1992,1991,1990,1989,1988,1987,1986,1985,1984,1983,1982,1981,1980,1979,1978,1977,1976,1975,1974,1973,1972,1971
This statistics in other country:
Timeline:
This timeline shows a graph from 1971 to 2007 of Kenya. No data until 1970. Number of actual observations by date: 37.
Source name:
World Development Indicators
Source organization:
World Bank, International Debt Statistics.
Categories, topics:
External Debt
Last updated:
apr 23, 2017
Indicators value changes by year
Minimum:
-106.442 mln
jan 1, 1995
Maximum:
107.947 mln
jan 1, 1985
At the date of observation
Value
Absolute change
Change from previous value
jan 1, 1971
1.838 mln
+1.838 mln
0.0%
jan 1, 1972
6.47 mln
+4.632 mln
252.01%
jan 1, 1973
20.649 mln
+14.179 mln
219.15%
jan 1, 1974
17.184 mln
-3.465 mln
-16.78%
jan 1, 1975
12.473 mln
-4.711 mln
-27.42%
jan 1, 1976
43.713 mln
+31.24 mln
250.46%
jan 1, 1977
63.551 mln
+19.838 mln
45.38%
jan 1, 1978
32.244 mln
-31.307 mln
-49.26%
jan 1, 1979
38.582 mln
+6.338 mln
19.66%
jan 1, 1980
33.357 mln
-5.225 mln
-13.54%
jan 1, 1981
34.561 mln
+1.204 mln
3.61%
jan 1, 1982
49.762 mln
+15.201 mln
43.98%
jan 1, 1983
72.198 mln
+22.436 mln
45.09%
jan 1, 1984
82.779 mln
+10.581 mln
14.66%
jan 1, 1985
107.947 mln
+25.168 mln
30.4%
jan 1, 1986
43.899 mln
-64.048 mln
-59.33%
jan 1, 1987
8.144 mln
-35.755 mln
-81.45%
jan 1, 1988
-20.967 mln
-29.111 mln
-357.45%
jan 1, 1989
-51.881 mln
-30.914 mln
147.44%
jan 1, 1990
-58.334 mln
-6.453 mln
12.44%
jan 1, 1991
-91.647 mln
-33.313 mln
57.11%
jan 1, 1992
-96.164 mln
-4.517 mln
4.93%
jan 1, 1993
-97.122 mln
-958.0K
1.0%
jan 1, 1994
-100.213 mln
-3.091 mln
3.18%
jan 1, 1995
-106.442 mln
-6.229 mln
6.22%
jan 1, 1996
-100.208 mln
+6.234 mln
-5.86%
jan 1, 1997
-88.496 mln
+11.712 mln
-11.69%
jan 1, 1998
-73.811 mln
+14.685 mln
-16.59%
jan 1, 1999
-65.868 mln
+7.943 mln
-10.76%
jan 1, 2000
-58.481 mln
+7.387 mln
-11.21%
jan 1, 2001
-40.409 mln
+18.072 mln
-30.9%
jan 1, 2002
-22.462 mln
+17.947 mln
-44.41%
jan 1, 2003
-11.848 mln
+10.614 mln
-47.25%
jan 1, 2004
-7.712 mln
+4.136 mln
-34.91%
jan 1, 2005
-4.764 mln
+2.948 mln
-38.23%
jan 1, 2006
-1.062 mln
+3.702 mln
-77.71%
jan 1, 2007
-4.0K
+1.058 mln
-99.62%
Ranking of countries by current statistics by years


Comments: