29
/
en
AIzaSyAYiBZKx7MnpbEhh9jyipgxe19OcubqV5w
April 1, 2024
179201
Liberia
LBR
true
2
1
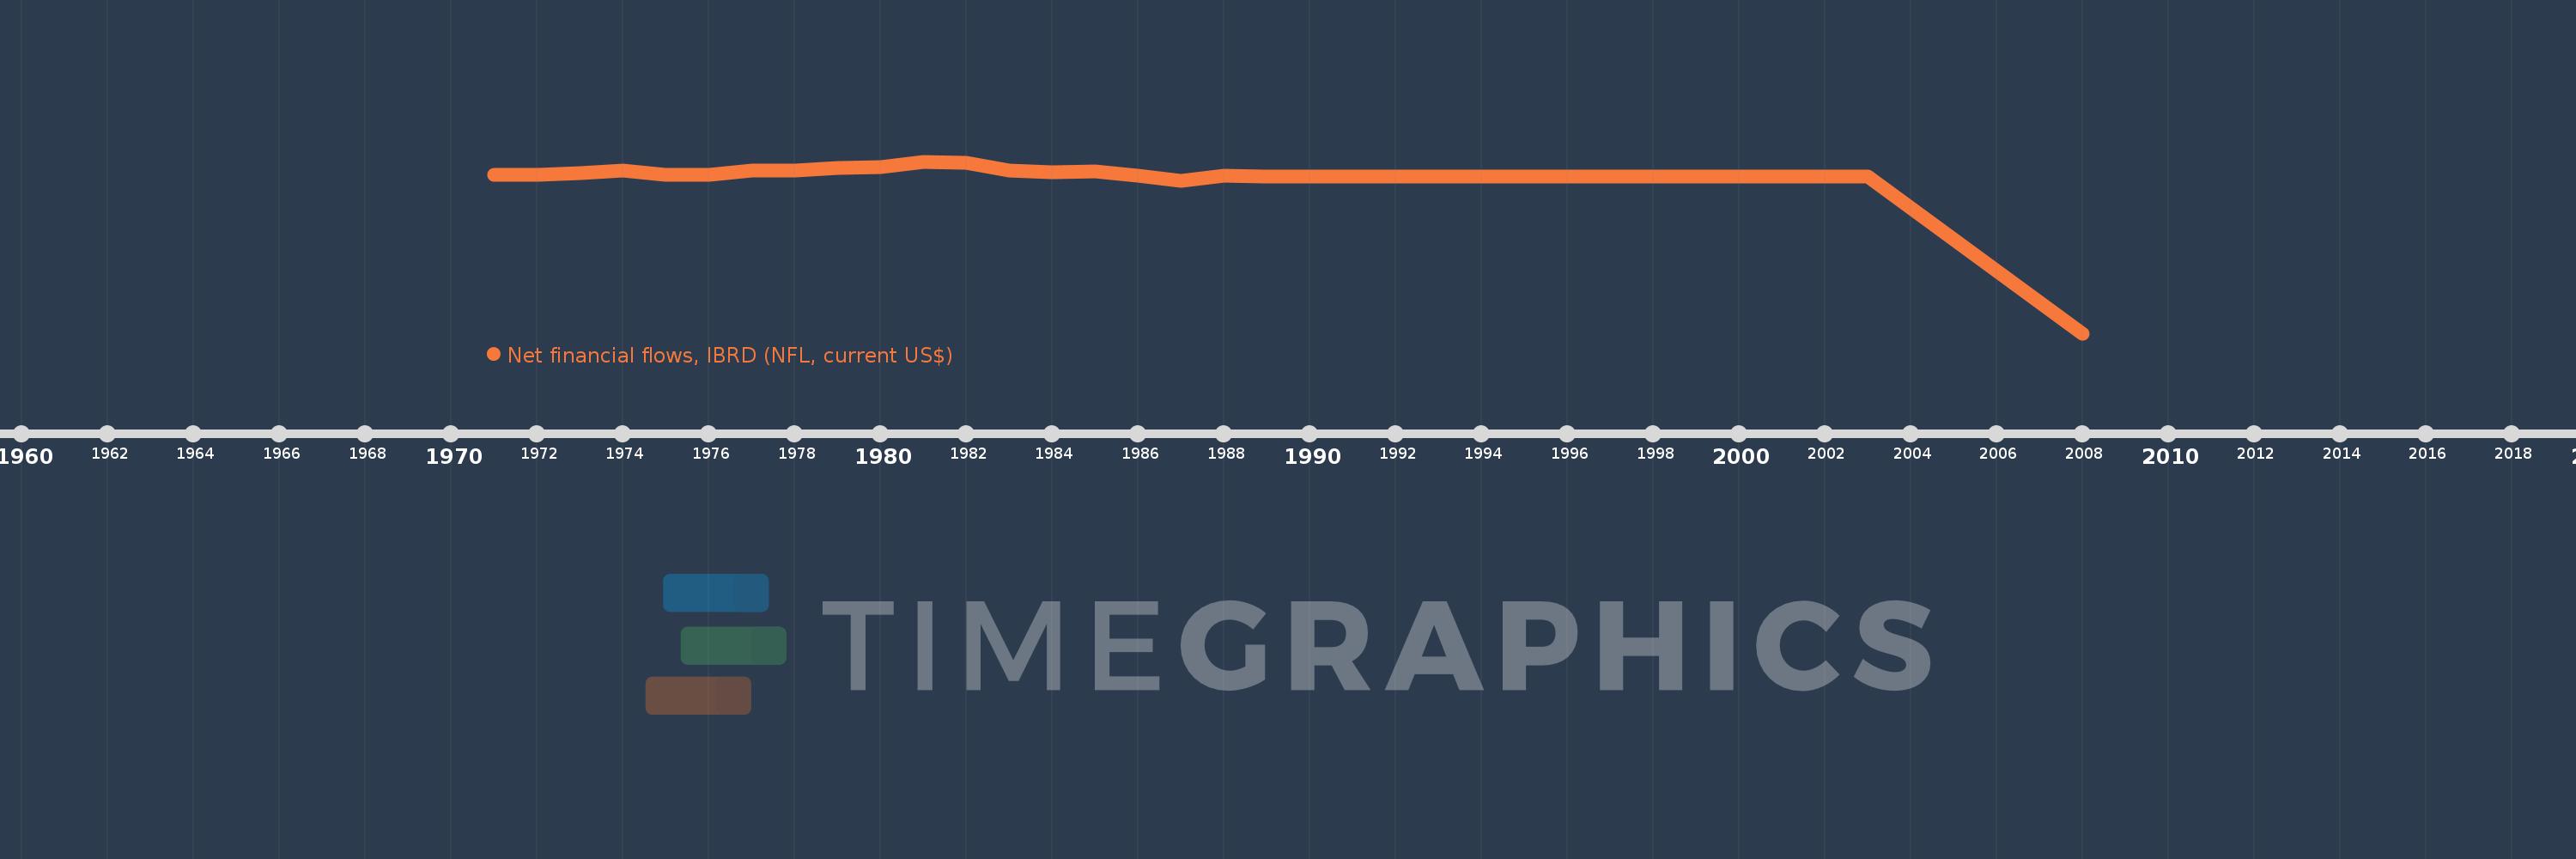
Net financial flows, IBRD (NFL, current US$)
2008,2003,1989,1988,1987,1986,1985,1984,1983,1982,1981,1980,1979,1978,1977,1976,1975,1974,1973,1972,1971
This statistics in other country:
Timeline:
This timeline shows a graph from 1971 to 2008 of Liberia. No data until 1970. Number of actual observations by date: 21.
Source name:
World Development Indicators
Source organization:
World Bank, International Debt Statistics.
Categories, topics:
External Debt
Last updated:
apr 23, 2017
Indicators value changes by year
Minimum:
-162.52 mln
jan 1, 2008
Maximum:
15.64 mln
jan 1, 1981
At the date of observation
Value
Absolute change
Change from previous value
jan 1, 1971
1.749 mln
+1.749 mln
0.0%
jan 1, 1972
1.806 mln
+57.0K
3.26%
jan 1, 1973
3.307 mln
+1.501 mln
83.11%
jan 1, 1974
5.973 mln
+2.666 mln
80.62%
jan 1, 1975
2.248 mln
-3.725 mln
-62.36%
jan 1, 1976
1.5 mln
-748.0K
-33.27%
jan 1, 1977
6.523 mln
+5.023 mln
334.87%
jan 1, 1978
6.522 mln
-1000.0
-0.02%
jan 1, 1979
8.526 mln
+2.004 mln
30.73%
jan 1, 1980
9.93 mln
+1.404 mln
16.47%
jan 1, 1981
15.64 mln
+5.71 mln
57.5%
jan 1, 1982
14.573 mln
-1.067 mln
-6.82%
jan 1, 1983
5.933 mln
-8.64 mln
-59.29%
jan 1, 1984
4.241 mln
-1.692 mln
-28.52%
jan 1, 1985
5.186 mln
+945.0K
22.28%
jan 1, 1986
650.0K
-4.536 mln
-87.47%
jan 1, 1987
-4.653 mln
-5.303 mln
-815.85%
jan 1, 1988
1.378 mln
+6.031 mln
-129.62%
jan 1, 1989
51.0K
-1.327 mln
-96.3%
jan 1, 2003
0.0
-51.0K
-100.0%
jan 1, 2008
-162.52 mln
-162.52 mln
%
Ranking of countries by current statistics by years


Comments: