29
/
en
AIzaSyAYiBZKx7MnpbEhh9jyipgxe19OcubqV5w
April 1, 2024
262629
Thailand
THA
true
2
1
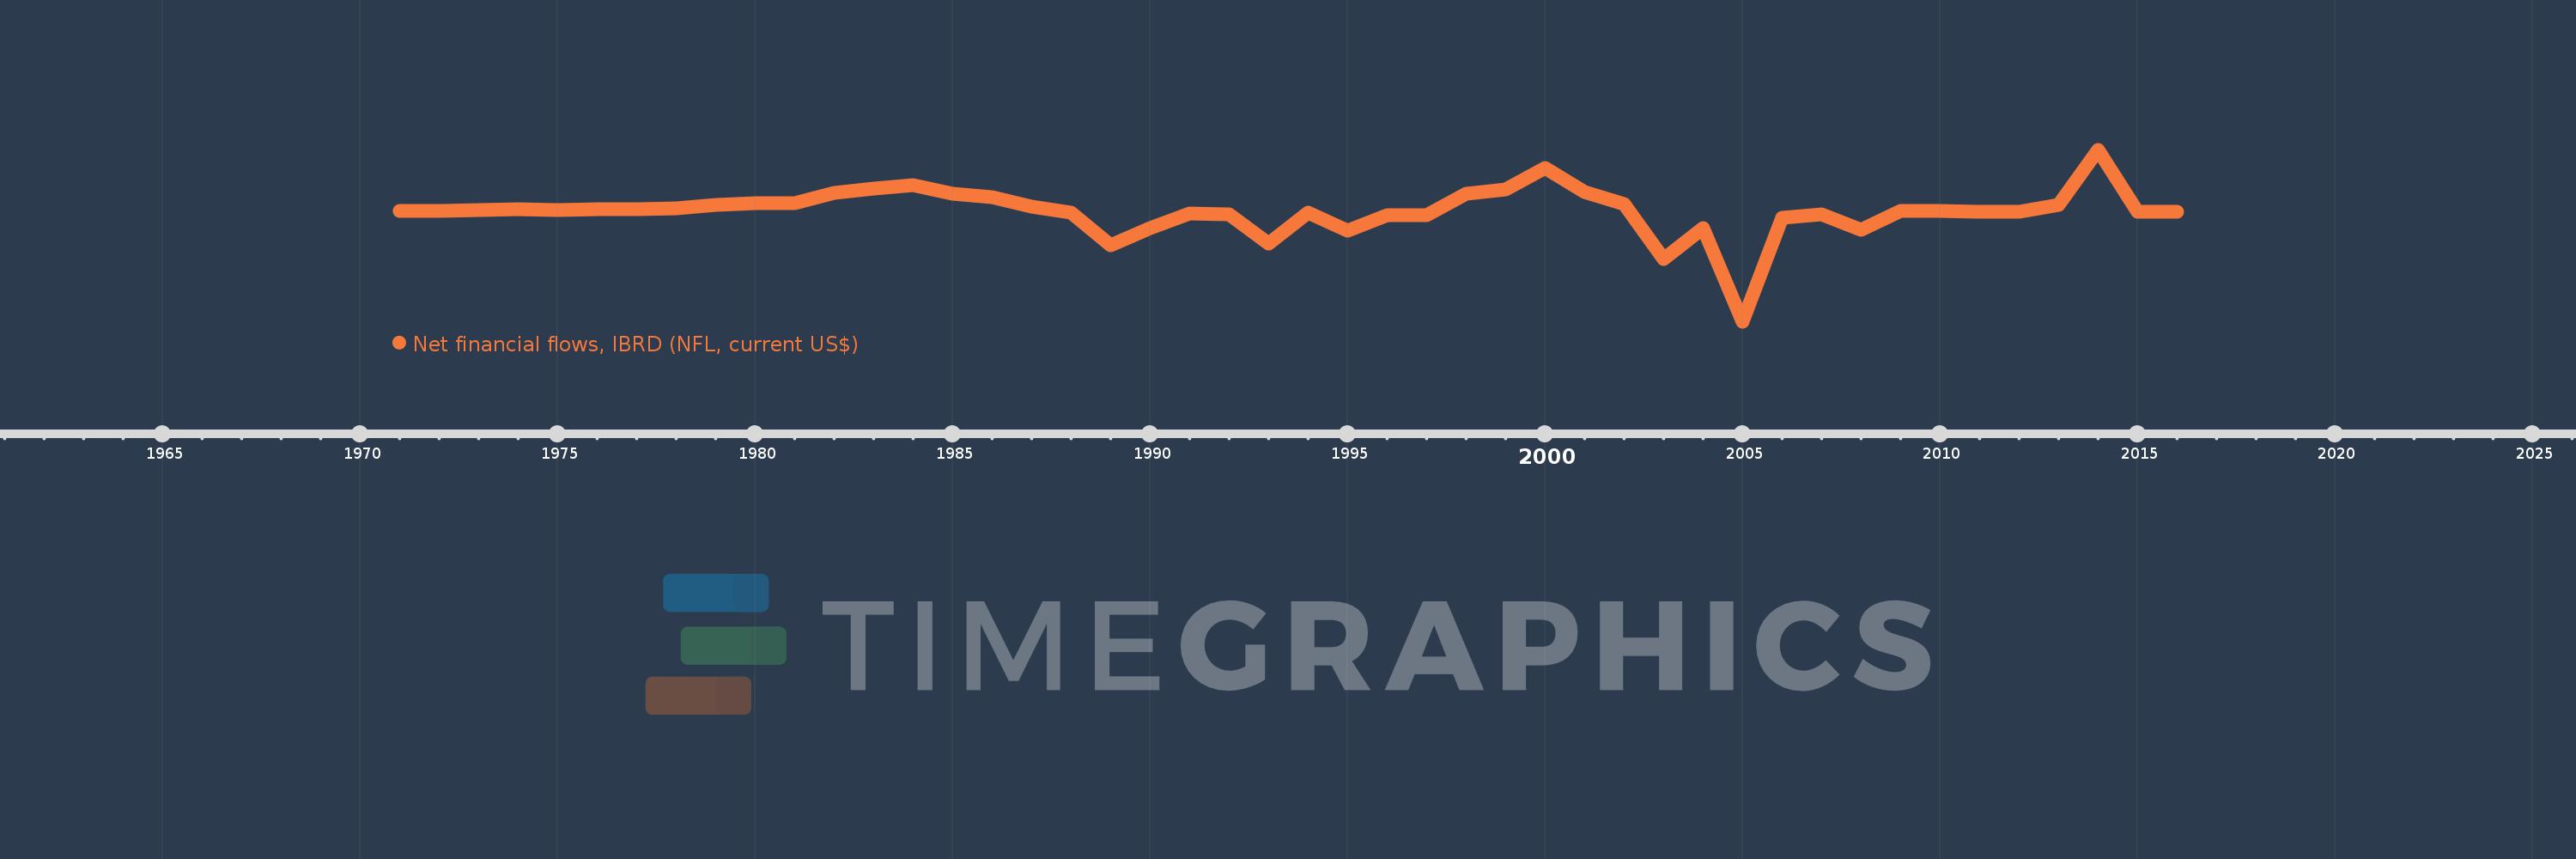
Net financial flows, IBRD (NFL, current US$)
2016,2015,2014,2013,2012,2011,2010,2009,2008,2007,2006,2005,2004,2003,2002,2001,2000,1999,1998,1997,1996,1995,1994,1993,1992,1991,1990,1989,1988,1987,1986,1985,1984,1983,1982,1981,1980,1979,1978,1977,1976,1975,1974,1973,1972,1971
This statistics in other country:
Timeline:
This timeline shows a graph from 1971 to 2016 of Thailand. No data until 1970. Number of actual observations by date: 46.
Source name:
World Development Indicators
Source organization:
World Bank, International Debt Statistics.
Categories, topics:
External Debt
Last updated:
apr 23, 2017
Indicators value changes by year
Minimum:
-1.615 bln
jan 1, 2005
Maximum:
890.375 mln
jan 1, 2014
At the date of observation
Value
Absolute change
Change from previous value
jan 1, 1971
9.833 mln
+9.833 mln
0.0%
jan 1, 1972
10.303 mln
+470.0K
4.78%
jan 1, 1973
21.794 mln
+11.491 mln
111.53%
jan 1, 1974
26.942 mln
+5.148 mln
23.62%
jan 1, 1975
22.963 mln
-3.979 mln
-14.77%
jan 1, 1976
28.437 mln
+5.474 mln
23.84%
jan 1, 1977
28.65 mln
+213.0K
0.75%
jan 1, 1978
47.347 mln
+18.697 mln
65.26%
jan 1, 1979
88.241 mln
+40.894 mln
86.37%
jan 1, 1980
117.524 mln
+29.283 mln
33.19%
jan 1, 1981
119.636 mln
+2.112 mln
1.8%
jan 1, 1982
264.631 mln
+144.995 mln
121.2%
jan 1, 1983
334.625 mln
+69.994 mln
26.45%
jan 1, 1984
380.991 mln
+46.366 mln
13.86%
jan 1, 1985
249.083 mln
-131.908 mln
-34.62%
jan 1, 1986
201.875 mln
-47.208 mln
-18.95%
jan 1, 1987
72.859 mln
-129.016 mln
-63.91%
jan 1, 1988
-26.538 mln
-99.397 mln
-136.42%
jan 1, 1989
-492.703 mln
-466.165 mln
1.76K%
jan 1, 1990
-245.997 mln
+246.706 mln
-50.07%
jan 1, 1991
-33.7 mln
+212.297 mln
-86.3%
jan 1, 1992
-46.843 mln
-13.143 mln
39.0%
jan 1, 1993
-468.532 mln
-421.689 mln
900.22%
jan 1, 1994
-20.011 mln
+448.521 mln
-95.73%
jan 1, 1995
-287.043 mln
-267.032 mln
1.33K%
jan 1, 1996
-55.497 mln
+231.546 mln
-80.67%
jan 1, 1997
-58.471 mln
-2.974 mln
5.36%
jan 1, 1998
251.033 mln
+309.504 mln
-529.33%
jan 1, 1999
319.17 mln
+68.137 mln
27.14%
jan 1, 2000
626.227 mln
+307.057 mln
96.2%
jan 1, 2001
275.132 mln
-351.095 mln
-56.07%
jan 1, 2002
105.517 mln
-169.615 mln
-61.65%
jan 1, 2003
-695.818 mln
-801.335 mln
-759.44%
jan 1, 2004
-250.42 mln
+445.398 mln
-64.01%
jan 1, 2005
-1.615 bln
-1.365 bln
544.91%
jan 1, 2006
-97.476 mln
+1.518 bln
-93.96%
jan 1, 2007
-50.174 mln
+47.302 mln
-48.53%
jan 1, 2008
-272.369 mln
-222.195 mln
442.85%
jan 1, 2009
1.629 mln
+273.998 mln
-100.6%
jan 1, 2010
9.301 mln
+7.672 mln
470.96%
jan 1, 2011
-1.697 mln
-10.998 mln
-118.25%
jan 1, 2012
-5.745 mln
-4.048 mln
238.54%
jan 1, 2013
95.497 mln
+101.242 mln
-1.76K%
jan 1, 2014
890.375 mln
+794.878 mln
832.36%
jan 1, 2015
-7.005 mln
-897.38 mln
-100.79%
jan 1, 2016
-7.229 mln
-224.0K
3.2%
Ranking of countries by current statistics by years


Comments: