29
/
en
AIzaSyAYiBZKx7MnpbEhh9jyipgxe19OcubqV5w
April 1, 2024
197927
Moldova
MDA
true
2
1
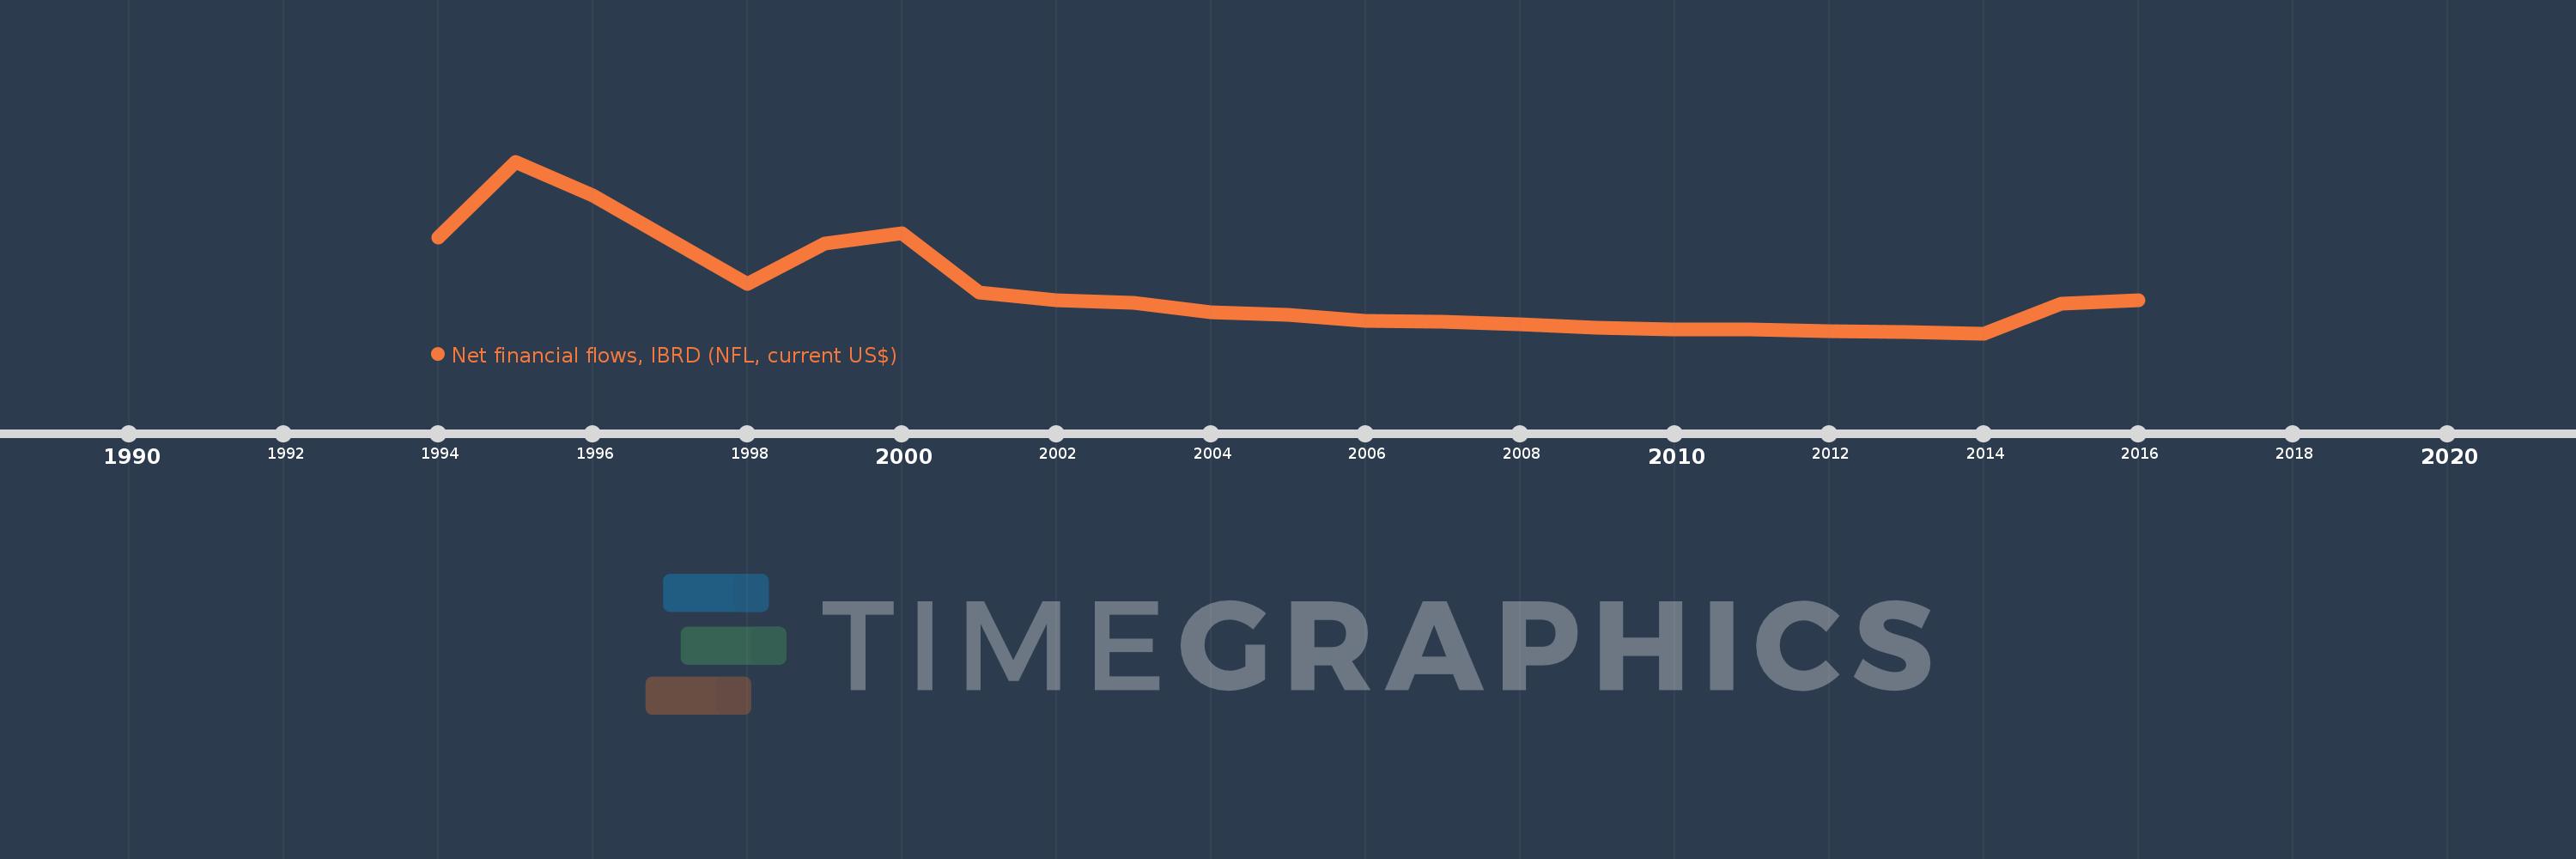
Net financial flows, IBRD (NFL, current US$)
2016,2015,2014,2013,2012,2011,2010,2009,2008,2007,2006,2005,2004,2003,2002,2001,2000,1999,1998,1996,1995,1994
This statistics in other country:
Timeline:
This timeline shows a graph from 1994 to 2016 of Moldova. No data until 1993. Number of actual observations by date: 22.
Source name:
World Development Indicators
Source organization:
World Bank, International Debt Statistics.
Categories, topics:
External Debt
Last updated:
apr 23, 2017
Indicators value changes by year
Minimum:
-19.687 mln
jan 1, 2014
Maximum:
67.092 mln
jan 1, 1995
At the date of observation
Value
Absolute change
Change from previous value
jan 1, 1994
28.573 mln
+28.573 mln
0.0%
jan 1, 1995
67.092 mln
+38.519 mln
134.81%
jan 1, 1996
50.158 mln
-16.934 mln
-25.24%
jan 1, 1998
5.394 mln
-44.764 mln
-89.25%
jan 1, 1999
25.602 mln
+20.208 mln
374.64%
jan 1, 2000
30.654 mln
+5.052 mln
19.73%
jan 1, 2001
800.0K
-29.854 mln
-97.39%
jan 1, 2002
-3.137 mln
-3.937 mln
-492.13%
jan 1, 2003
-4.42 mln
-1.283 mln
40.9%
jan 1, 2004
-9.073 mln
-4.653 mln
105.27%
jan 1, 2005
-10.398 mln
-1.325 mln
14.6%
jan 1, 2006
-13.397 mln
-2.999 mln
28.84%
jan 1, 2007
-13.884 mln
-487.0K
3.64%
jan 1, 2008
-15.039 mln
-1.155 mln
8.32%
jan 1, 2009
-16.847 mln
-1.808 mln
12.02%
jan 1, 2010
-17.592 mln
-745.0K
4.42%
jan 1, 2011
-17.767 mln
-175.0K
0.99%
jan 1, 2012
-18.579 mln
-812.0K
4.57%
jan 1, 2013
-19.213 mln
-634.0K
3.41%
jan 1, 2014
-19.687 mln
-474.0K
2.47%
jan 1, 2015
-4.778 mln
+14.909 mln
-75.73%
jan 1, 2016
-3.171 mln
+1.607 mln
-33.63%
Ranking of countries by current statistics by years


Comments: