29
/
en
AIzaSyAYiBZKx7MnpbEhh9jyipgxe19OcubqV5w
April 1, 2024
221207
Paraguay
PRY
true
2
1
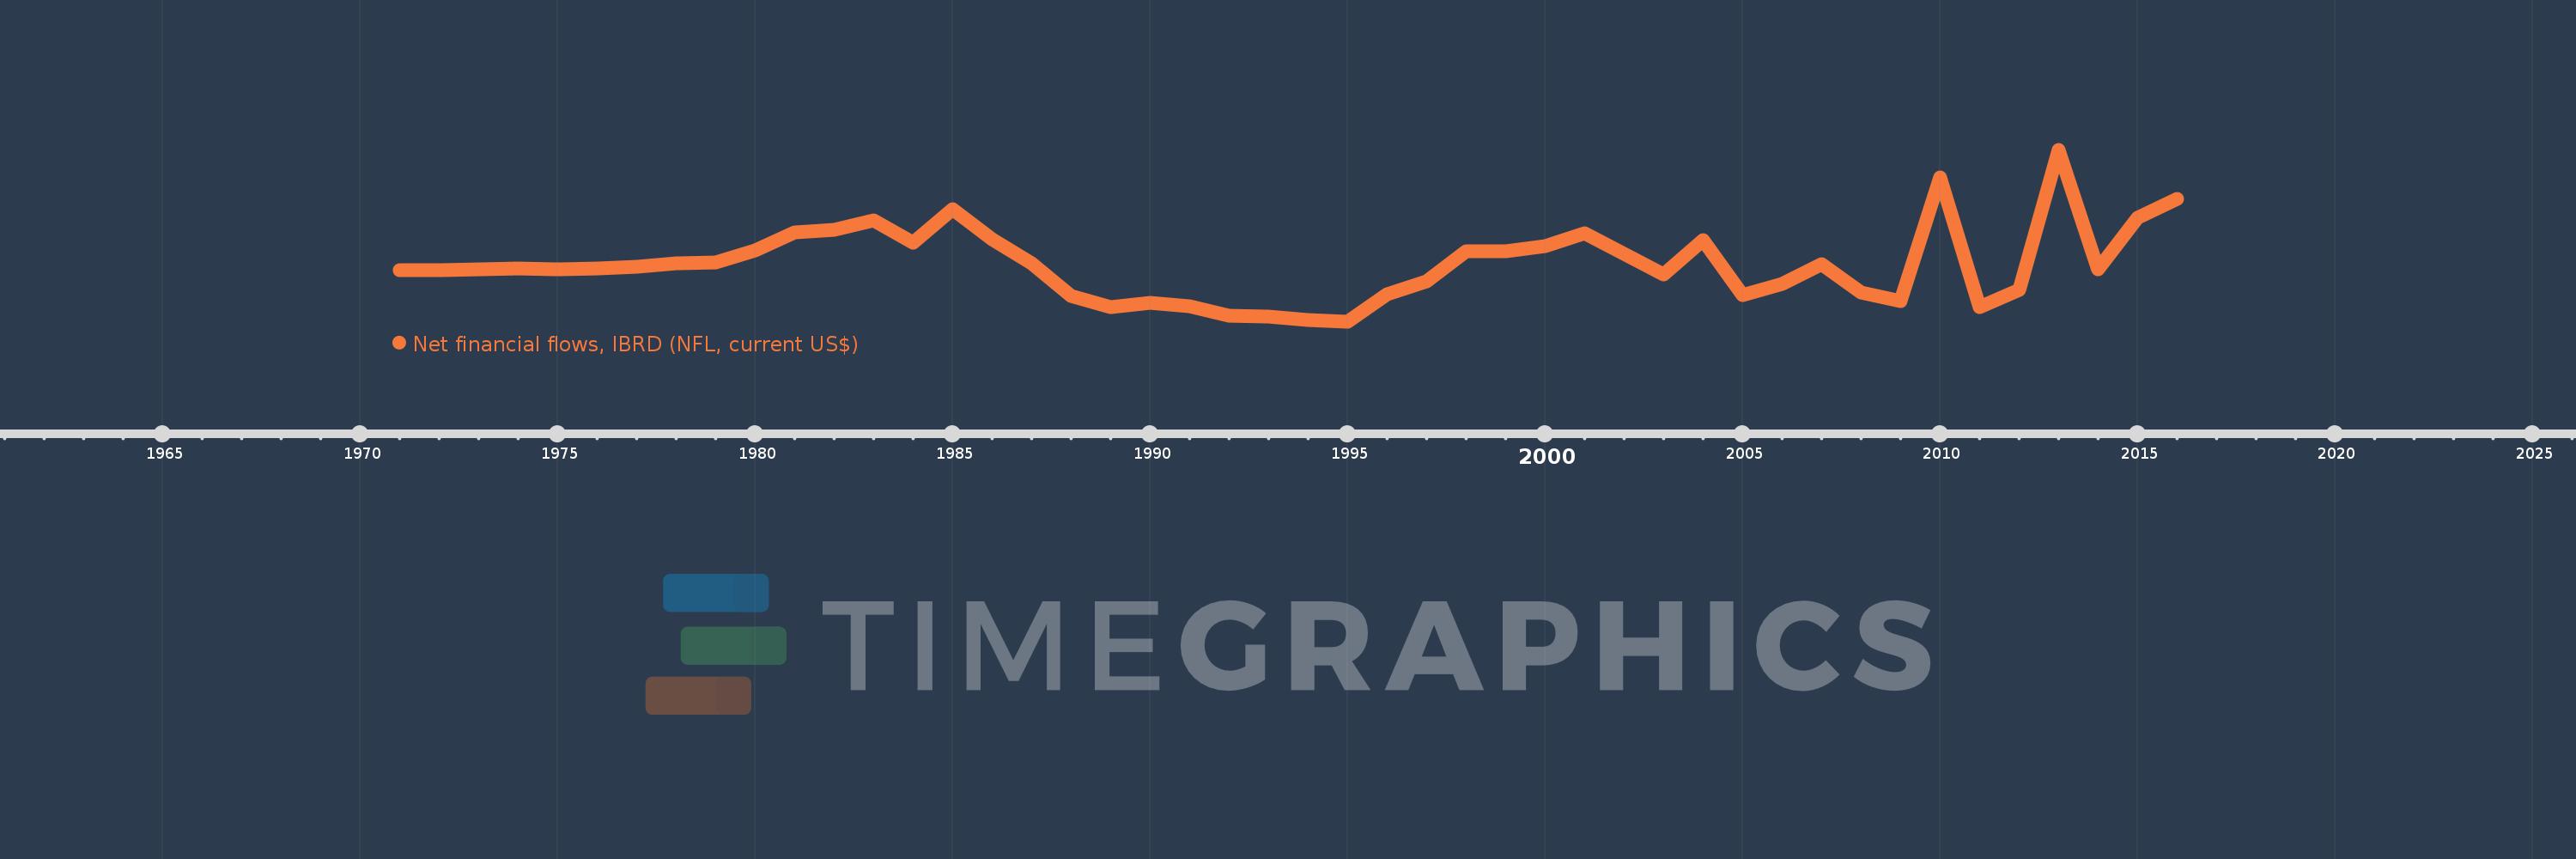
Net financial flows, IBRD (NFL, current US$)
2016,2015,2014,2013,2012,2011,2010,2009,2008,2007,2006,2005,2004,2003,2002,2001,2000,1999,1998,1997,1996,1995,1994,1993,1992,1991,1990,1989,1988,1987,1986,1985,1984,1983,1982,1981,1980,1979,1978,1977,1976,1975,1974,1973,1972,1971
This statistics in other country:
Timeline:
This timeline shows a graph from 1971 to 2016 of Paraguay. No data until 1970. Number of actual observations by date: 46.
Source name:
World Development Indicators
Source organization:
World Bank, International Debt Statistics.
Categories, topics:
External Debt
Last updated:
apr 23, 2017
Indicators value changes by year
Minimum:
-35.633 mln
jan 1, 1995
Maximum:
87.367 mln
jan 1, 2013
At the date of observation
Value
Absolute change
Change from previous value
jan 1, 1971
1.406 mln
+1.406 mln
0.0%
jan 1, 1972
1.679 mln
+273.0K
19.42%
jan 1, 1973
2.22 mln
+541.0K
32.22%
jan 1, 1974
2.518 mln
+298.0K
13.42%
jan 1, 1975
2.119 mln
-399.0K
-15.85%
jan 1, 1976
2.559 mln
+440.0K
20.76%
jan 1, 1977
3.945 mln
+1.386 mln
54.16%
jan 1, 1978
6.198 mln
+2.253 mln
57.11%
jan 1, 1979
7.069 mln
+871.0K
14.05%
jan 1, 1980
15.422 mln
+8.353 mln
118.16%
jan 1, 1981
28.625 mln
+13.203 mln
85.61%
jan 1, 1982
30.391 mln
+1.766 mln
6.17%
jan 1, 1983
37.077 mln
+6.686 mln
22.0%
jan 1, 1984
20.886 mln
-16.191 mln
-43.67%
jan 1, 1985
45.24 mln
+24.354 mln
116.6%
jan 1, 1986
23.855 mln
-21.385 mln
-47.27%
jan 1, 1987
6.155 mln
-17.7 mln
-74.2%
jan 1, 1988
-16.784 mln
-22.939 mln
-372.69%
jan 1, 1989
-24.874 mln
-8.09 mln
48.2%
jan 1, 1990
-21.625 mln
+3.249 mln
-13.06%
jan 1, 1991
-24.12 mln
-2.495 mln
11.54%
jan 1, 1992
-31.437 mln
-7.317 mln
30.34%
jan 1, 1993
-31.577 mln
-140.0K
0.45%
jan 1, 1994
-34.237 mln
-2.66 mln
8.42%
jan 1, 1995
-35.633 mln
-1.396 mln
4.08%
jan 1, 1996
-15.482 mln
+20.151 mln
-56.55%
jan 1, 1997
-6.326 mln
+9.156 mln
-59.14%
jan 1, 1998
15.267 mln
+21.593 mln
-341.34%
jan 1, 1999
14.682 mln
-585.0K
-3.83%
jan 1, 2000
18.96 mln
+4.278 mln
29.14%
jan 1, 2001
27.899 mln
+8.939 mln
47.15%
jan 1, 2002
12.972 mln
-14.927 mln
-53.5%
jan 1, 2003
-1.88 mln
-14.852 mln
-114.49%
jan 1, 2004
22.875 mln
+24.755 mln
-1.32K%
jan 1, 2005
-16.663 mln
-39.538 mln
-172.84%
jan 1, 2006
-8.241 mln
+8.422 mln
-50.54%
jan 1, 2007
5.836 mln
+14.077 mln
-170.82%
jan 1, 2008
-14.414 mln
-20.25 mln
-346.98%
jan 1, 2009
-20.732 mln
-6.318 mln
43.83%
jan 1, 2010
68.113 mln
+88.845 mln
-428.54%
jan 1, 2011
-25.003 mln
-93.116 mln
-136.71%
jan 1, 2012
-12.877 mln
+12.126 mln
-48.5%
jan 1, 2013
87.367 mln
+100.244 mln
-778.47%
jan 1, 2014
1.922 mln
-85.445 mln
-97.8%
jan 1, 2015
39.005 mln
+37.083 mln
1.93K%
jan 1, 2016
52.456 mln
+13.451 mln
34.49%
Ranking of countries by current statistics by years


Comments: