29
/
en
AIzaSyAYiBZKx7MnpbEhh9jyipgxe19OcubqV5w
April 1, 2024
31900
Europe & Central Asia (excluding high income)
ECA
false
2
1
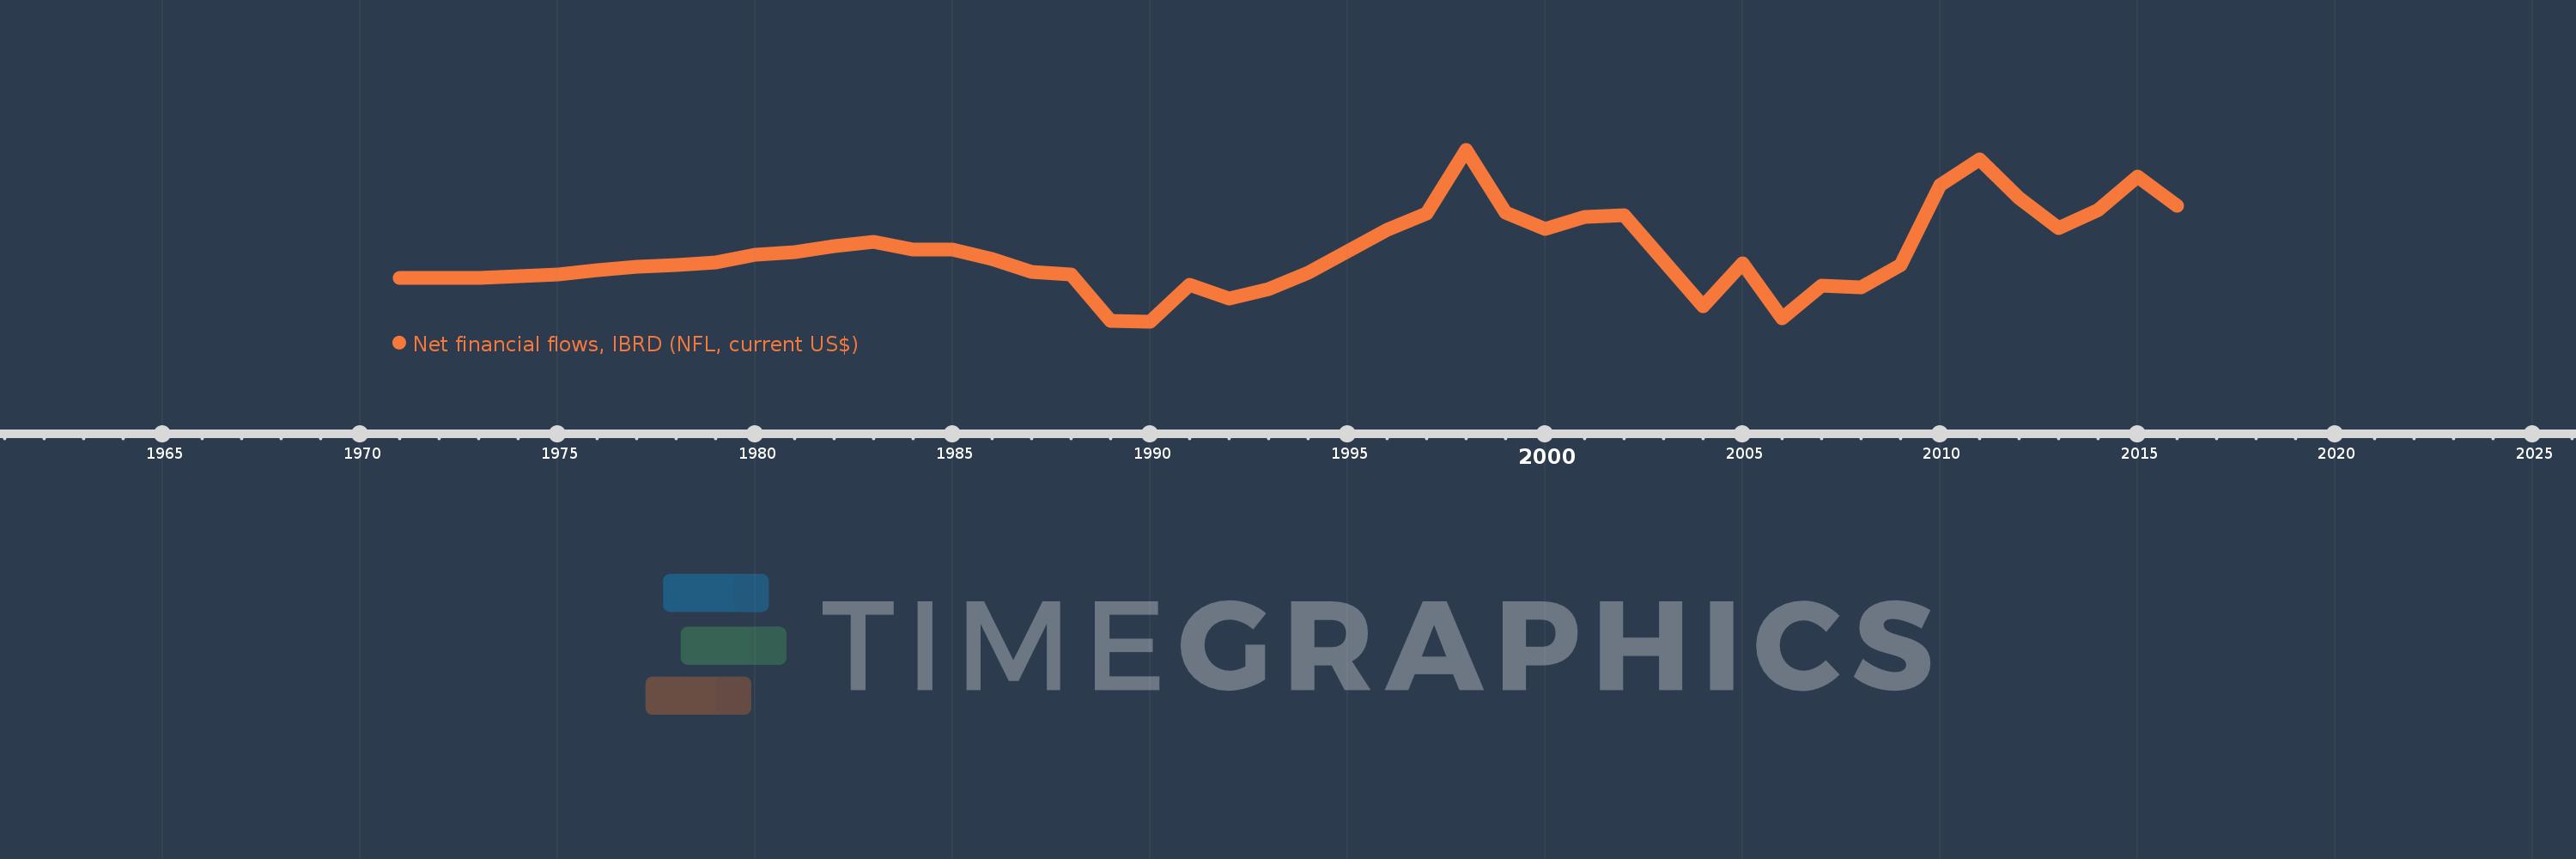
Net financial flows, IBRD (NFL, current US$)
2016,2015,2014,2013,2012,2011,2010,2009,2008,2007,2006,2005,2004,2003,2002,2001,2000,1999,1998,1997,1996,1995,1994,1993,1992,1991,1990,1989,1988,1987,1986,1985,1984,1983,1982,1981,1980,1979,1978,1977,1976,1975,1974,1973,1972,1971
This statistics in other country:
Timeline:
This timeline shows a graph from 1971 to 2016 of Europe & Central Asia (excluding high income). No data until 1970. Number of actual observations by date: 46.
Source name:
World Development Indicators
Source organization:
World Bank, International Debt Statistics.
Categories, topics:
External Debt
Last updated:
apr 23, 2017
Indicators value changes by year
Minimum:
-1.053 bln
jan 1, 1990
Maximum:
3.242 bln
jan 1, 1998
At the date of observation
Value
Absolute change
Change from previous value
jan 1, 1971
42.012 mln
+42.012 mln
0.0%
jan 1, 1972
51.991 mln
+9.979 mln
23.75%
jan 1, 1973
59.096 mln
+7.105 mln
13.67%
jan 1, 1974
84.357 mln
+25.261 mln
42.75%
jan 1, 1975
139.976 mln
+55.619 mln
65.93%
jan 1, 1976
233.431 mln
+93.455 mln
66.77%
jan 1, 1977
323.88 mln
+90.449 mln
38.75%
jan 1, 1978
367.904 mln
+44.024 mln
13.59%
jan 1, 1979
441.036 mln
+73.132 mln
19.88%
jan 1, 1980
622.673 mln
+181.637 mln
41.18%
jan 1, 1981
700.229 mln
+77.556 mln
12.46%
jan 1, 1982
850.904 mln
+150.675 mln
21.52%
jan 1, 1983
957.278 mln
+106.374 mln
12.5%
jan 1, 1984
763.663 mln
-193.615 mln
-20.23%
jan 1, 1985
764.297 mln
+634.0K
0.08%
jan 1, 1986
517.737 mln
-246.56 mln
-32.26%
jan 1, 1987
195.108 mln
-322.629 mln
-62.32%
jan 1, 1988
128.77 mln
-66.338 mln
-34.0%
jan 1, 1989
-1.017 bln
-1.146 bln
-889.93%
jan 1, 1990
-1.053 bln
-36.087 mln
3.55%
jan 1, 1991
-129.558 mln
+923.721 mln
-87.7%
jan 1, 1992
-469.328 mln
-339.77 mln
262.25%
jan 1, 1993
-240.877 mln
+228.451 mln
-48.68%
jan 1, 1994
181.684 mln
+422.561 mln
-175.43%
jan 1, 1995
722.013 mln
+540.329 mln
297.4%
jan 1, 1996
1.244 bln
+522.038 mln
72.3%
jan 1, 1997
1.663 bln
+418.64 mln
33.65%
jan 1, 1998
3.242 bln
+1.579 bln
94.98%
jan 1, 1999
1.69 bln
-1.552 bln
-47.88%
jan 1, 2000
1.264 bln
-425.73 mln
-25.2%
jan 1, 2001
1.583 bln
+318.527 mln
25.2%
jan 1, 2002
1.609 bln
+26.934 mln
1.7%
jan 1, 2003
468.044 mln
-1.141 bln
-70.92%
jan 1, 2004
-653.096 mln
-1.121 bln
-239.54%
jan 1, 2005
405.808 mln
+1.059 bln
-162.14%
jan 1, 2006
-953.912 mln
-1.36 bln
-335.06%
jan 1, 2007
-149.465 mln
+804.447 mln
-84.33%
jan 1, 2008
-177.915 mln
-28.45 mln
19.03%
jan 1, 2009
373.891 mln
+551.806 mln
-310.15%
jan 1, 2010
2.361 bln
+1.987 bln
531.47%
jan 1, 2011
3.009 bln
+648.379 mln
27.46%
jan 1, 2012
2.049 bln
-960.794 mln
-31.93%
jan 1, 2013
1.293 bln
-755.501 mln
-36.88%
jan 1, 2014
1.754 bln
+460.64 mln
35.62%
jan 1, 2015
2.58 bln
+825.855 mln
47.09%
jan 1, 2016
1.86 bln
-719.097 mln
-27.88%
Ranking of countries by current statistics by years


Comments: